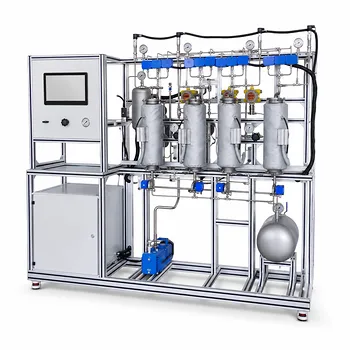
Your students calculate a chloride ion ratio and use it to trigger a precise water management action. In a cooling tower pilot plant, cycles of concentration (CoC) are directly monitored by comparing the chloride concentration in the recirculating sump water to that in the fresh makeup water. Students use the Mohr titration method to measure these chloride levels and total hardness. When the CoC ratio gets too high, they activate blowdown or increase makeup flow to flush out concentrated dissolved solids, preventing calcium-based scale from precipitating on heat transfer surfaces.
The core principle is simple: track a conservative ion like chloride to gauge overall concentration, then act before scaling thresholds are reached. Mastering this teaches students the critical link between water chemistry analysis and real-time operational control.
The Chemistry of CoC and Why It Prevents Disaster
Understanding the Concentration Mechanism
As water evaporates in a cooling tower, pure water vapor leaves, but almost all dissolved solids stay behind. The remaining water becomes more concentrated with each cycle.
The cycles of concentration quantify exactly how many times the makeup water has been "shrunk" by evaporation. A CoC of 5 means dissolved solids in the tower water are five times more concentrated than in the incoming makeup.
Chloride as the Perfect Tracer
Chloride ions are chemically conservative—they do not participate in scale-forming reactions or degrade. This makes them the ideal yardstick.
Students measure chloride via the Mohr method, a simple argentometric titration using potassium chromate indicator. The endpoint is a distinct reddish-brown silver chromate precipitate.
Mathematically, CoC = Cl⁻_sump / Cl⁻_makeup. This single number tells them how close the system is to a scaling event.
The True Threat: Calcium Hardness
Scaling occurs when calcium ions react with alkalinity (carbonate/bicarbonate) to form calcium carbonate (CaCO₃). The solubility product is finite.
As CoC rises, the calcium hardness concentration eventually exceeds the local supersaturation limit. The result is a hard, insulating scale layer on heat exchanger tubes, reducing efficiency and increasing energy costs.
Students use EDTA complexometric titration to measure total hardness, giving them a real-time view of how close the water is to its stability boundary.
From Measurement to Control: The Operational Loop
Setting the Critical Limit
Every water source has a maximum allowable CoC based on its calcium and alkalinity levels. Students first analyze the makeup water to calculate the Langelier Saturation Index (LSI) or a simpler practical threshold.
If the measured CoC approaches this limit, they must intervene. The limit is typically chosen so that calcium hardness remains below the solubility product at the highest heat transfer surface temperature.
The Two Control Levers: Blowdown and Makeup
Blowdown is the intentional removal of concentrated water from the sump. It directly reduces dissolved solids.
Makeup water dilutes the system. By increasing makeup flow while keeping blowdown constant, the equilibrium CoC drops.
Students learn to balance these levers. The relationship is:
( \text{CoC} = \frac{\text{Evaporation} + \text{Blowdown}}{\text{Blowdown}} )
So for a fixed evaporation rate, raising the blowdown rate lowers the CoC.
Monitoring Frequency and Data Logging
In pilot-scale training, students typically test chloride and hardness every shift. This frequency reflects industrial practice where water quality can change due to ambient conditions or makeup water variation.
Data is logged against time and linked to blowdown events. This creates a time-lapsed profile of scaling potential, teaching students to see patterns and anticipate problems rather than just react.
Understanding the Trade-offs and Pitfalls
The Water-Energy-Chemical Nexus
Over-blowing down wastes water and sends more chemical treatment (inhibitors, dispersants) to drain. Under-blowing down invites scale.
Students must learn that perfect chemical control can be economically worse than a slight sacrifice in CoC. The optimum is often found by comparing the cost of water and chemicals against the cost of reduced heat transfer or unplanned cleaning.
The Danger of Single-Parameter Reliance
Chloride tracking assumes the makeup water composition is stable. If the source changes (e.g., a utility switches groundwater sources), the CoC target becomes invalid overnight.
Likewise, calcium concentration alone doesn’t tell the whole story. Alkalinity, pH, and temperature at the heat transfer surface all shift the scaling boundary. Ignoring these variables leads to false confidence.
Parallel Lessons from Crystallizer Pilot Plants
Though different equipment, the supplementary crystallizer references reinforce the same fundamental truth: scaling prevention depends on maintaining parameters within a narrow metastable window.
In a DTB crystallizer, high slurry circulation and boiling away from walls prevent nucleation on surfaces. In a cooling Oslo crystallizer, a temperature difference kept below 2°C avoids nucleation on tubes.
Both teach students that scaling is a boundary-violation problem—not a slow buildup, but a sudden failure when a threshold is crossed. The same applies to cooling towers: cross the solubility limit, and scale forms rapidly.
Making the Right Choice for Your Training Goal
How you emphasize these monitoring and control methods depends on your specific learning objectives for the pilot plant.
- If your primary focus is teaching hands-on analytical skills: Center the lab sessions on the Mohr titration for chlorides and the EDTA titration for hardness. Let students physically calculate CoC and compare results against a known scale limit.
- If your primary focus is operational decision-making: Build scenarios where students receive water analysis data and must choose a blowdown rate, then observe the downstream effects on energy efficiency or simulated scale thickness.
- If your primary focus is system optimization and sustainability: Add a cost-accounting layer. Challenge students to minimize total water use while keeping the CoC safely below the scaling threshold over a multi-day run.
- If your primary focus is understanding the fundamentals of scaling: Use the CoC monitoring as a springboard to discuss supersaturation, nucleation kinetics, and the role of temperature, tying in insights from crystallizer pilot plant operations to show universality across unit operations.
A pilot plant is the bridge between theory and industrial reality—teaching students that the chloride ion and a burette give them the power to predict and prevent one of the most common process failures.
Summary Table:
| Parameter | Measurement Method | Operational Role |
|---|---|---|
| Chloride Ratio | Mohr Titration ($Cl^-{sump}/Cl^-{makeup}$) | Tracks Cycles of Concentration (CoC) |
| Calcium Hardness | EDTA Complexometric Titration | Monitors supersaturation and scale threshold |
| Blowdown Flow | Flow control valve adjustment | Flushes concentrated solids to lower CoC |
| Makeup Flow | Flow control valve adjustment | Dilutes the system with fresh water |
Ready to enhance your hands-on process education? LABPARK provides premium Educational and Vocational Unit Operations Pilot Plants in chemical engineering, bioprocess & biotech, and environmental & water treatment. We help universities, research institutes, and enterprises train the next generation of engineers with real-world water chemistry and process control systems.
Contact LABPARK today to find the perfect pilot plant for your lab!
Related Products
- Educational Compression Refrigeration Performance Determination Unit Operations Pilot Plant
- Dual Mode Heat Transfer Pilot Plant for Unit Operations Training
- Three-Tube Heat Transfer Educational Pilot Plant for Unit Operations Training
- Multi-Reactor Educational Pilot Plant for Reaction Engineering Unit Operations
- Multi-Functional Drying Educational Unit Operations Pilot Plant
People Also Ask
- What is the analytical procedure for measuring trace copper in pilot plant waters? Colorimetric method.
- How Fourier filtering benefits PLS calibration of inline bioprocess sensors to boost accuracy
- How to Differentiate Orthophosphate and Polyphosphate? Master Colorimetric Analysis
- How do GC thermal stability & nonvolatiles affect reaction monitoring? Practical Solutions for Chemical Engineers
- What is the role of mock-ups or cold flow models in chemical engineering process scale-up and pilot plant design?