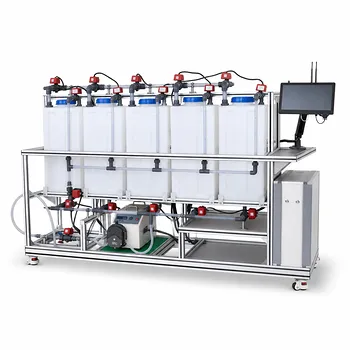
Educational chemical engineering pilot units make the comparison experimental rather than purely theoretical. By running the same reaction at several controlled temperatures, researchers measure concentration changes, determine rate constants, and fit the results to both the standard Arrhenius model, (k=Ae^{-E/(RT)}), and a Collision Theory form, (k=A'T^{1/2}e^{-E/(RT)}). The resulting rate predictions can then be compared across the tested temperature range and evaluated against the measured reactor performance.
Pilot units connect molecular kinetic theory to real reactor data: controlled temperature experiments reveal whether the additional (T^{1/2}) dependence in Collision Theory produces a meaningful improvement over the conventional Arrhenius representation.
How Pilot Units Generate Comparable Kinetic Data
Controlled temperature operation
Educational pilot units commonly use jacketed batch reactors, continuous stirred-tank reactors, or tubular reactors. Their heating and cooling systems allow the reaction to be operated at several known, approximately isothermal temperatures.
Temperature control is essential because both models predict that (k) changes strongly with absolute temperature. Each run should use the same feed composition, residence time or sampling schedule, mixing conditions, and catalyst state so that temperature is the primary changing variable.
Concentration measurements
Researchers collect reactant concentration data over time in batch operation, or at defined reactor locations and residence times in continuous operation. These measurements provide the information needed to calculate reaction rates and rate constants.
For a bimolecular reaction such as (A+B\rightarrow C+D), a representative rate law is
[ -r_A=k(T)C_AC_B. ]
The measured concentration data are used to estimate (k(T)) at each operating temperature.
Integral and differential analysis
The integral method fits concentration-time data to the integrated form of an assumed rate law. For example, a suitable concentration plot can produce a straight line whose slope gives the rate constant.
The differential method estimates (-dC_A/dt) from the experimental data at different concentrations. It can help verify the reaction order or test whether the selected kinetic mechanism is consistent with the observations.
Both methods can be applied before comparing the temperature models. This prevents differences between Arrhenius and Collision Theory from being confused with errors in reaction-order assumptions.
How the Two Models Are Fitted
Standard Arrhenius model
The conventional model is
[ k(T)=A\exp\left(-\frac{E}{RT}\right), ]
where (A) is treated as a temperature-independent frequency factor, (E) is the activation energy, (R) is the gas constant, and (T) is absolute temperature.
Taking logarithms gives
[ \ln k=\ln A-\frac{E}{R}\frac{1}{T}. ]
A plot of (\ln k) against (1/T) should be approximately linear. The slope provides (-E/R), while the intercept provides (\ln A).
Collision Theory model
Collision Theory introduces a temperature-dependent prefactor:
[ k(T)=A'T^{1/2}\exp\left(-\frac{E}{RT}\right). ]
The (T^{1/2}) term reflects the increase in molecular thermal velocity with temperature. The factor (A') also represents effects such as collision frequency, molecular size, and the fraction of collisions with an appropriate orientation.
This model can be linearized as
[ \ln\left(\frac{k}{T^{1/2}}\right)
\ln A'
\frac{E}{R}\frac{1}{T}. ]
Researchers therefore fit both transformed datasets and compare the resulting activation energies, prefactors, residuals, and predicted rate constants.
Direct nonlinear fitting
A pilot-unit study can also fit the untransformed data directly using nonlinear regression. This approach avoids giving disproportionate weight to low-rate observations that may occur after logarithmic transformation.
The same measured (k(T)) values should be supplied to both models, and the models should be compared using consistent error metrics such as residual error, confidence intervals, and prediction error at temperatures not used for fitting.
What the Temperature Comparison Reveals
The exponential term dominates
Both models contain the same activation-energy term,
[ \exp\left(-\frac{E}{RT}\right). ]
That term usually dominates the temperature sensitivity, so the two models can produce very similar predictions over the operating range of an educational reactor.
Collision Theory predicts a gradual additional increase
Relative to the standard Arrhenius form, Collision Theory includes the factor (T^{1/2}). For two temperatures (T_1) and (T_2), the additional ratio contributed by this factor is
[ \left(\frac{T_2}{T_1}\right)^{1/2}. ]
Consequently, Collision Theory generally predicts a slightly larger rate-constant ratio over a temperature span. Under the assumptions in the reference model, the difference is typically on the order of 1% to 2%, although the exact value depends on the temperature range and fitted parameters.
Experimental uncertainty matters
The predicted difference may be smaller than the uncertainty caused by temperature measurement, concentration analysis, mixing, sampling, or parameter fitting. A pilot unit allows researchers to determine whether the distinction is experimentally resolvable rather than assuming that a more detailed prefactor is automatically more accurate.
Connecting Molecular Theory to Reactor Performance
From rate constants to conversion
Once each model provides (k(T)), researchers insert the values into the appropriate reactor design equation. They can then calculate conversion, residence-time requirements, heat-removal demands, or concentration profiles.
For example, the two models may produce nearly identical conversion predictions at one temperature but increasingly different predictions as the operating range expands.
Testing scale-up predictions
The exercise also shows why kinetic parameters cannot be separated from operating conditions. A model that fits a narrow laboratory range may produce a different extrapolation at pilot or industrial temperatures.
Running the reaction in a larger, instrumented unit exposes practical influences such as heat-transfer limitations, temperature gradients, mass-transfer effects, and residence-time distribution. These effects must be controlled or modeled before attributing discrepancies solely to kinetic theory.
Evaluating activation energy and prefactors
Researchers can extract an experimental activation energy and frequency factor from the measured data. Comparing the fitted parameters shows how the choice of prefactor changes the interpretation of (A) and (E).
The fitted Arrhenius activation energy is an empirical parameter. It should not automatically be identified with a molecular energy barrier without considering the specific theoretical model and the temperature range of the experiment.
Understanding the Trade-offs
The Arrhenius model is simpler
The standard Arrhenius equation is easy to fit, widely used, and often sufficiently accurate over a limited temperature interval. Its parameters are convenient for reactor design calculations and process simulations.
Its main limitation is that treating (A) as constant may conceal temperature dependence that becomes relevant over a broad range.
Collision Theory is more physically explicit
The Collision Theory expression connects the prefactor to molecular motion and collision frequency. It can therefore provide a more physically interpretable explanation for why the prefactor changes with temperature.
However, the (T^{1/2}) dependence is not a universal replacement for every real reaction mechanism. Steric factors, molecular interactions, solvent effects, diffusion, and complex reaction pathways can introduce additional temperature dependence.
Reactor effects can obscure the comparison
A measured rate constant is meaningful only if the observed rate is controlled by chemical kinetics. Poor mixing, heat-transfer limitations, external mass transfer, or sensor delays can make an apparent rate constant differ from the intrinsic kinetic value.
Pilot-unit experiments should therefore include checks for isothermal behavior, adequate mixing, analytical response time, and reproducibility between runs.
Linear plots can mislead
A visually straight Arrhenius plot does not prove that the underlying mechanism is correct. Different mechanisms can appear linear over a narrow temperature range, and noise in concentration data can distort slopes and intercepts.
Model selection should combine statistical fit quality with physical plausibility, independent validation, and knowledge of the reactor’s transport conditions.
Making the Right Choice for Your Goal
The pilot-unit comparison is most useful when the experimental design separates kinetic effects from reactor and measurement effects.
- If your primary focus is simple reactor design: Use the standard Arrhenius model when it fits the measured data adequately over the intended operating range.
- If your primary focus is molecular interpretation: Fit the Collision Theory form and examine whether the temperature-dependent (T^{1/2}) prefactor is supported by the data.
- If your primary focus is model discrimination: Operate across the widest safe, well-controlled temperature range and compare residuals, uncertainty intervals, and out-of-sample predictions.
- If your primary focus is process scale-up: Validate both kinetic models against conversion, temperature, and residence-time data while checking for heat- and mass-transfer limitations.
- If your primary focus is teaching reaction engineering: Use the same pilot-unit dataset to demonstrate rate-law determination, Arrhenius parameter extraction, and the practical limits of theoretical models.
By combining controlled reactor experiments with consistent model fitting, educational pilot units show exactly where Arrhenius law is sufficient and where Collision Theory provides additional predictive value.
Summary Table:
| Comparison Area | Arrhenius Model | Collision Theory Model |
|---|---|---|
| Rate expression | k = A exp(-E/RT) |
k = A'T^(1/2) exp(-E/RT) |
| Temperature dependence | Exponential activation-energy term | Exponential term plus a T^(1/2) prefactor |
| Experimental data | Rate constants measured at several controlled temperatures | The same rate-constant dataset is used |
| Linearized fit | Plot ln k against 1/T |
Plot ln(k/T^(1/2)) against 1/T |
| Main strength | Simple, established, and practical for reactor design | Provides a more explicit molecular interpretation |
| Typical difference | Often produces similar predictions over limited ranges | May predict a 1% to 2% higher temperature effect, depending on conditions |
| Key limitations | Constant prefactor may hide temperature dependence | Steric, solvent, diffusion, and mechanism effects may require additional terms |
| Validation requirements | Compare residuals, uncertainty, and predictions | Also check mixing, heat transfer, mass transfer, and measurement effects |
Need reliable reaction-kinetics data for teaching, research, or process scale-up? Contact LABPARK to discuss Educational and Vocational Unit Operations Pilot Plants tailored to your application. LABPARK supports universities, research institutes, and enterprises with chemical engineering, bioprocess and biotech, and environmental and water treatment pilot systems. Our instrumented units help your team measure rate constants, compare Arrhenius and Collision Theory models, validate reactor performance, identify transport limitations, and build practical confidence before scaling experiments to larger systems.
Related Products
- Carbon Dioxide Hydrogen Methanol Synthesis Educational Unit Operations Pilot Plant
- Multi-Functional Special Distillation Educational Pilot Plant
- Multi-Reactor Educational Pilot Plant for Reaction Engineering Unit Operations
- Fixed Bed Gas Solid Catalytic Reaction Educational Pilot Plant
- Tubular Reactor Flow Characteristics Determination Educational Unit Operations Pilot Plant
People Also Ask
- How do temp & pressure affect methanol synthesis pilot plants? Optimize equilibrium and catalyst performance.
- Why is a purge system necessary when operating a gas recirculation loop in a methanol synthesis pilot plant? (Guide)
- Why do modern methanol pilot plants operate at lower pressures? Catalyst & Feed Requirements Explained
- What are the operational requirements for catalyst activation? Safe Methanol Pilot Plant Operation
- Why is the chemical plant startup schedule crucial? De-risk scale-up with pilot plants.