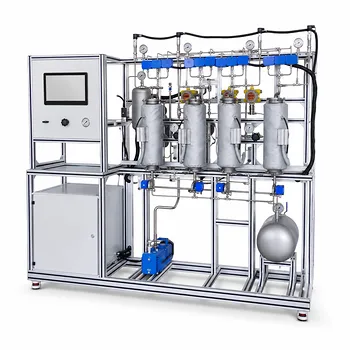
The secret to transforming a simulated moving bed (SMB) pilot plant from a timed black box into a precision separation instrument lies in closing the data gap. Integrating real-time near-infrared (NIR) spectroscopy directly into the process stream replaces the 40-minute delay of offline gas chromatography (GC) with sub-minute, multi-component concentration monitoring of closely related isomers and their extractant. By placing fiber-optic probes at critical points—such as the extract and raffinate lines—and building a chemometric model calibrated on the 2100–2500 nm spectral region, you gain the ability to dynamically adjust zone flow rates, switch times, and desorbent ratios, directly optimizing purity, yield, and solvent consumption in real time.
The core insight is that the bottleneck in SMB isomer separation optimization isn’t the adsorption physics—it’s the analytical delay. NIR spectroscopy overcomes this by delivering a continuous, non-destructive composition data stream that enables true closed-loop control, turning a slow batch-monitoring process into an instantaneous, data-driven separation.
Why Real-Time Data Rewrites the Rules of SMB Separation
The GC Bottleneck That Holds You Back
Offline gas chromatography is the traditional workhorse for tracking isomers like ortho-, meta-, and para-diethylbenzene during SMB operation. But each GC run can take up to 40 minutes, and manual sampling introduces delays, handling errors, and a painful scarcity of data points.
You end up operating on timed cycles based on earlier, now-stale concentration profiles. That means purity drifts, desorbent is wasted, and separation potential remains untapped because you’re always reacting to the past.
The NIR Advantage: Speed Without Sacrifice
Inline NIR spectroscopy changes the game by measuring isomer and extractant (e.g., p-xylene) concentrations in under one minute. The measurement is non-destructive, requires no sample preparation, and can be performed continuously with a fiber-optic probe immersed in the flowing process stream.
The secret lies in the spectral region between 2100 and 2500 nm. Here, the overtones and combination bands of C–H bonds produce sharp, isomer-specific absorption peaks that differ subtly but measurably between ortho, meta, and para structures. With a well-calibrated partial least squares (PLS) model, those spectral differences translate directly into real-time concentration readouts.
A Window into Your SMB Loop
When NIR probes are placed on the extract stream (rich in the preferentially adsorbed isomer) and the raffinate stream (rich in the less-adsorbed isomer), you instantly see how purity and recovery evolve as zone flow rates change. Simultaneously monitoring the extractant concentration in the extract line reveals the effectiveness of your desorbent recovery step.
This continuous visibility enables you to switch from time-based to composition-based control. Instead of a fixed switch interval, you trigger port rotation when the extract purity begins to drop, maximizing yield while staying on-spec.
How to Integrate NIR into an SMB Pilot Plant
1. Choose the Measurement Points Strategically
Location is everything. For isomer separation optimization, the highest-value measurement spots are the product withdrawal lines. Install a transmission or diffuse-reflectance fiber-optic probe directly in the extract line to monitor the target isomer purity and extractant carryover.
A second probe in the raffinate line provides the complementary recovery metric. If your feed composition varies (a common industrial reality), you may also want a feed-stream probe to enable feed-forward control, adjusting zone flows before a disturbance hits the separation.
2. Navigate the Spectral Landscape
Focus your full-range spectrometer (e.g., InGaAs detector, 1100–2500 nm) on the 2100–2500 nm wavelength window. This region contains the most intense and differentiated C–H overtone/combination bands for alkylbenzene isomers. The meta and para isomers of diethylbenzene, for example, show subtle but repeatable peak shifts here that a multivariate model can exploit.
A fast-scanning spectrometer with a cooled detector will give you the signal-to-noise ratio needed to see these small spectral differences reliably in a flowing process stream.
3. Build the Predictive Engine
Calibration is the critical step. You must collect a set of calibration samples that span the entire range of isomer and extractant concentrations you expect to see. Analyze each sample with your primary reference method (GC) and simultaneously record its NIR spectrum.
Apply a partial least squares (PLS) regression to correlate the spectral matrix with the reference concentrations. Pre-processing steps like multiplicative scatter correction and derivative transforms will compensate for baseline shifts caused by temperature, particle size, or probe fouling. Validate the model with independent test samples to ensure standard errors of prediction are acceptable for your separation targets (e.g., <0.1% absolute for purity).
4. From Spectral Data to Real-Time Control
Connect the spectrometer’s data output to your pilot plant’s control system (PLC/DCS) using an OPC or Modbus interface. Set the PLS model to predict concentrations with every new scan, and build a control loop that adjusts:
- Zone I (desorbent) flow rate: to control desorbent consumption based on real-time extractant concentration.
- Feed flow rate: adjusted via feed-forward when feed composition changes are detected by a probe upstream.
- Switch time: reduced or extended based on the approach to purity constraints in the extract, ensuring the separation front stays perfectly aligned with the port timing.
The result is autonomous, composition-driven optimization instead of manual, delayed corrections.
Understanding the Trade-offs: NIR Integration Isn’t Free
The Chemometrics Learning Curve
Implementing NIR successfully demands a solid understanding of multivariate calibration. Building and maintaining robust PLS models is not a plug-and-play task—it requires careful experimental design, outlier detection, and regular model updates as column aging or feed quality shifts occur.
The Price of Precision: Calibration vs. Model Robustness
The model will only be as good as the reference data. Achieving high precision for isomers with nearly identical spectra means you need an extensive, well-designed calibration set that captures all process variations. Variations in temperature, pressure, or trace impurities not seen during calibration can silently degrade model accuracy.
Probe Fouling and Maintenance
Process streams containing polymers, fines, or adsorbent dust can foul the probe window. A fouled probe introduces scattering that can mimic concentration changes. You’ll need an automatic retraction or cleaning system, or a robust chemometric strategy (like a fouling index) to flag and compensate for drift.
Hardware Cost and Integration Complexity
A research-grade NIR spectrometer, fiber optics, and flow cells represent a significant capital investment. Additionally, retrofitting a pressurized SMB loop with optical access ports requires engineering work to ensure safety and avoid dead volumes that distort the separation profile.
Making the Right Choice for Your SMB Pilot Plant Goals
The decision to integrate NIR should be driven by what you most need to achieve with your pilot plant.
- If your primary focus is maximizing purity for high-value isomer fractions: Prioritize an extract-line NIR probe to trigger switch-time changes the moment purity begins to degrade. The payback is immediate in on-spec product without over-fractionation.
- If your primary focus is reducing desorbent and energy consumption: Monitor both extractant concentration and raffinate purity in real time, then feed that data into a controller that minimizes desorbent flow while still meeting recovery targets. The savings compound over multi-day runs.
- If your primary focus is providing hands-on PAT education to students or researchers: Use the SMB isomer separation as a rich, multi-variable case study. The NIR integration forces students to tackle calibration design, chemometrics, and real-time control code—exactly the skills industry demands.
- If your primary focus is operating a multi-feed flexible pilot plant: Install an NIR probe on the feed line first. Feed-forward control based on rapid NIR analysis (paraffins, isoparaffins, aromatics in a naphtha feed, for example) allows you to maintain separation performance across feedstock transitions without manual intervention.
Real-time NIR spectroscopy transforms an SMB pilot plant from an open-loop experiment into an intelligent, self-optimizing separation system—the exact kind of technology that bridges the gap between academic study and industrial process control.
Summary Table:
| Feature | Offline Gas Chromatography (GC) | Inline NIR Spectroscopy |
|---|---|---|
| Measurement Delay | ~40 minutes | Sub-minute (real-time) |
| Control Action | Open-loop, time-based | Closed-loop, composition-based |
| Sample Handling | Manual sampling, destructive | Continuous, non-destructive |
| Optimization Impact | Prone to purity drift & waste | Max yield & minimal desorbent waste |
Elevate your research and training with LABPARK. We provide advanced Educational and Vocational Unit Operations Pilot Plants across chemical engineering, bioprocess & biotech, and environmental & water treatment. Tailored for universities, research institutes, and enterprises, our modular plants seamlessly integrate real-time PAT tools like NIR to optimize processes and enhance hands-on learning. Contact our experts today to find the perfect pilot plant solution for your lab!
Related Products
- Packed Bed Absorption Educational Unit Operations Pilot Plant
- Absorption and Desorption Educational Unit Operations Pilot Plant
- Pressure Swing Adsorption Educational Unit Operations Pilot Plant
- Multimodal Absorption and Desorption Pilot Plant for Unit Operations Training
- High-Gravity Emulsification and Mass Transfer Educational Pilot Plant
People Also Ask
- How Do Flow Regimes Transition in Packed Bed Pilot Plants? Key Scale-up Insights
- How does reactant concentration determine absorption column control? Gas-film vs. dual-film.
- How is the packing height of an absorption column calculated? Master HTU & NTU Concepts
- How does static vs. operating holdup affect pilot plant calibration? Avoid Critical Scale-Up Errors
- Why is counter-current flow selected for gas absorption? Maximize Pilot Plant Efficiency