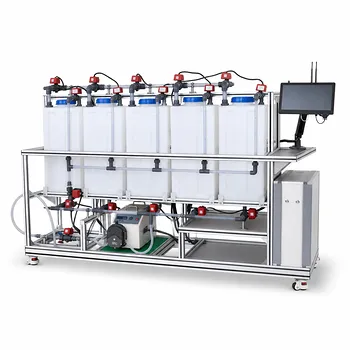
Process economics and break-even analysis can justify energy-recovery equipment by converting technical performance into a measurable financial case. Engineers compare the equipment’s annual energy savings with its capital cost, depreciation, operating expenses, and expected service life. If the savings recover the investment within an acceptable period and continue producing lifecycle benefits, the equipment has a defensible economic basis for inclusion in a water-treatment or desalination pilot plant.
The central question is not whether energy-recovery equipment saves energy, but whether the value of those savings exceeds the equipment’s ownership and operating costs. A combined cost breakdown, annual profit analysis, and break-even calculation provides the evidence.
Start With the Process Economics
Define the Economic Decision
The decision is usually between two configurations: the pilot plant without energy recovery and the modified plant with energy-recovery equipment.
The comparison should use the same production target, operating schedule, feed conditions, and performance requirements. This isolates the economic effect of the proposed equipment.
Convert Energy Performance Into Annual Savings
The technical study must estimate how much electricity, heating, refrigeration, or other utility consumption the equipment will avoid.
For example, a precooler may reduce the duty required from downstream refrigeration equipment. The resulting reduction in annual electricity cost becomes the primary economic benefit.
A useful calculation is:
[ \text{Annual energy savings}
\text{Annual baseline energy cost}
\text{Annual energy cost with recovery} ]
The estimate should reflect actual pilot-plant operating hours and expected utilization rather than assuming continuous operation.
Include All Incremental Costs
Energy savings are only one side of the calculation. The analysis should also include additional costs caused by the equipment, such as:
- Maintenance and replacement parts
- Pumps or fans required to circulate streams
- Cleaning and fouling control
- Instrumentation and controls
- Additional labor
- Waste handling
- Any change in treatment chemicals or operating procedures
The equipment may reduce one utility demand while increasing another. The relevant value is the net operating-cost reduction, not the gross saving from a single utility.
Calculate the Annual Economic Benefit
Use a Net Annual Profit Calculation
A simplified annual comparison is:
[ \text{Net annual profit change}
\text{Additional revenue}
\text{Additional operating costs}
\text{Annual depreciation} ]
For energy-recovery equipment that does not increase product sales, additional revenue may be zero. The principal benefit is then the reduction in operating costs.
The resulting value indicates how the modification affects reported annual profit under the selected accounting treatment.
Apply the Depreciation Assumption
Straight-line depreciation can be calculated as:
[ \text{Annual depreciation}
\frac{\text{Capital cost}}{\text{Useful life}} ]
For a precooler costing $30,000 with a three-year useful life:
[ \text{Annual depreciation}
\frac{$30{,}000}{3}
$10{,}000\text{/year} ]
If the equipment reduces annual electricity costs by $18,000, the simplified annual profit increase is:
[ $18{,}000-$10{,}000
$8{,}000\text{/year} ]
This shows that the equipment creates a positive annual accounting contribution under the stated assumptions.
Keep Profitability Separate From Cash Payback
Depreciation is an accounting expense, not a cash payment made each year. Therefore, it is appropriate for evaluating reported profit, but a cash break-even or payback calculation should focus on the initial capital outlay and actual annual cash savings.
For the example above, the simple cash payback before other operating costs would be:
[ \frac{$30{,}000}{$18{,}000} \approx 1.7\text{ years} ]
That distinction matters. A project can show a particular accounting profit effect while having a different cash payback period.
Use Cost Analysis to Find the Best Target
Break Down the Existing Cost Structure
Before proposing energy recovery, engineers should identify where the pilot plant spends money.
A Pareto analysis can separate total operating cost into categories such as:
- Raw materials
- Electricity
- Refrigeration
- Heating
- Labor
- Waste treatment
This reveals whether utilities are large enough to justify design attention.
Focus on the Largest Utility Consumers
If electricity or refrigeration is a major cost category, energy-recovery equipment may have meaningful economic potential.
The analysis should then focus on the largest consumers, such as refrigeration compressors or fired heaters, and quantify how much of their duty the proposed modification can eliminate.
Avoid Optimizing the Wrong Cost
If raw materials dominate total operating cost, reducing a relatively small refrigeration load may have limited overall impact.
Likewise, when conversion is already close to 100%, further conversion improvements may produce little value. The stronger economic opportunity may instead be improved selectivity, reduced byproduct formation, or lower unrecoverable material losses.
Process economics therefore determines whether energy recovery is the right intervention, rather than assuming that every energy-saving modification is worthwhile.
Determine the Break-Even Point
Compare Cumulative Costs Over Time
A graphical comparison can plot cumulative cost for:
- Operating without energy recovery
- Purchasing and operating with energy recovery
The modified configuration begins with a higher cost because of the capital investment. Over time, its lower utility consumption causes the cumulative cost curves to converge.
The point where the two curves intersect is the break-even time.
Interpret a 1.7-Year Break-Even
Using the example assumptions, the equipment recovers its $30,000 capital cost through $18,000 of annual electricity savings in approximately 1.7 years, before additional operating costs.
If the equipment remains in service beyond that point, the energy-recovery configuration has lower cumulative cost, assuming the operating assumptions remain valid.
Test the Result Against Pilot-Plant Reality
The calculation should be repeated using realistic scenarios for:
- Operating hours
- Electricity prices
- Energy-recovery effectiveness
- Feed and product temperatures
- Equipment availability
- Maintenance cost
- Fouling or performance degradation
- Equipment useful life
This shows whether the break-even result is robust or depends on an optimistic operating case.
Understanding the Trade-Offs
Capital Cost Can Delay the Benefit
Energy-recovery equipment requires an upfront investment, while its savings accumulate gradually.
A modification with attractive long-term economics may still be unsuitable if the pilot budget, project duration, or funding approval requires a shorter payback period.
Pilot Plants May Operate Below Design Capacity
Pilot equipment often runs intermittently or at lower throughput than a commercial plant.
Lower utilization reduces annual energy savings and lengthens the actual payback period. The analysis should therefore use the pilot’s expected operating schedule and separately consider whether the equipment would be more valuable in a future full-scale design.
Savings Can Be Offset by New Operating Requirements
Heat exchangers, precoolers, pumps, and associated controls can introduce fouling, pressure drop, cleaning requirements, and maintenance work.
These effects should be assigned economic values wherever possible. Otherwise, the analysis risks overstating the benefit by counting avoided energy while ignoring the equipment’s operational burden.
Accounting Results Do Not Establish the Entire Investment Case
A positive annual profit change does not by itself prove that the project is financially attractive.
A complete investment decision may also require cash-flow timing, residual value, financing assumptions, taxes, and a discount rate. For a pilot study, the simplified profit and payback calculations are useful screening tools, but they should be labeled accordingly.
Making the Right Choice for Your Goal
Use the economic analysis to connect the equipment’s measured process benefit with the decision the project must make.
- If your primary focus is reducing pilot-plant operating cost: Quantify annual net utility savings, subtract incremental operating expenses, and confirm that the resulting benefit is positive.
- If your primary focus is recovering the capital investment quickly: Calculate simple cash payback from the initial cost and annual net cash savings, excluding depreciation from the cash calculation.
- If your primary focus is selecting the best process modification: Use Pareto analysis to identify whether refrigeration, electricity, heating, raw materials, labor, or waste treatment is the dominant cost target.
- If your primary focus is supporting future commercial scale-up: Evaluate the equipment under realistic full-scale operating hours and test the result against energy prices, utilization, fouling, and maintenance assumptions.
- If your primary focus is reporting annual profitability: Include depreciation and incremental operating costs in the net annual profit calculation, while keeping the accounting result distinct from cash payback.
A well-supported energy-recovery proposal shows not only that energy use falls, but that the resulting savings justify the equipment over its operating life.
Summary Table:
| Decision factor | What to evaluate | Why it matters |
|---|---|---|
| Energy savings | Baseline utility cost versus cost with recovery | Quantifies the primary financial benefit |
| Incremental costs | Maintenance, pumps, cleaning, controls, labor, and waste handling | Prevents overstating net savings |
| Annual profit impact | Energy savings minus operating costs and depreciation | Measures the accounting contribution |
| Cash payback | Capital cost divided by annual net cash savings | Shows how quickly the investment is recovered |
| Cost priorities | Electricity, refrigeration, heating, materials, labor, and waste treatment | Identifies the most valuable improvement target |
| Pilot-plant conditions | Operating hours, utilization, fouling, maintenance, and energy prices | Tests whether the business case is realistic |
| Scale-up potential | Full-scale throughput and long-term operating assumptions | Determines future commercial value |
| Investment decision | Cash flow, useful life, residual value, financing, taxes, and discount rate | Supports a complete economic assessment |
Planning a water-treatment or desalination pilot plant? Contact LABPARK to discuss your project requirements. LABPARK provides Educational and Vocational Unit Operations Pilot Plants for universities, research institutes, and enterprises, including chemical engineering, bioprocess and biotechnology, and environmental and water-treatment systems. Our pilot plants help your team measure energy performance, validate recovery technologies, compare operating costs, and generate reliable data for scale-up and investment decisions.
Related Products
- Electrochemical Water Treatment Educational Unit Operations Pilot Plant
- Thermal Desorption Exhaust Gas and Tail Water Treatment Educational Pilot Plant
- Water Electrolysis Hydrogen Production and Storage Educational Pilot Plant
- Steam Methane Reforming Hydrogen Production and Purification Educational Pilot Plant
- Electrolytic Hydrogen Production Educational Unit Operations Pilot Plant
People Also Ask
- What design features do educational electrochemical pilot plants utilize to manage gas liberation and water loss?
- How can unit operations pilot plants show lead-acid concentration vs state of charge? Real-time monitoring guide.
- How do educational electrochemical pilot plants scale up electrolysis? Master industrial engineering.
- How to Estimate Sulfate in Water Treatment Pilot Plant Deposits: Gravimetric Guide
- How can foaming be managed during steam generation experiments in water treatment unit operations pilot plants? Tips