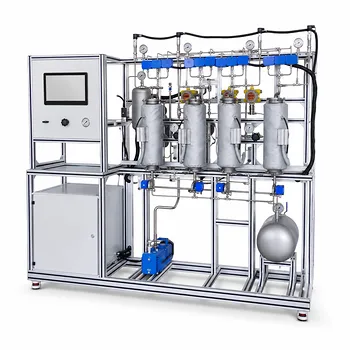
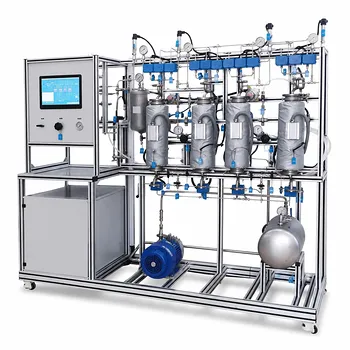
Turning a pilot plant into a precision instrument for mass transfer analysis isn’t just about turning valves—it’s about decoding the hidden dynamics of gas-liquid contact.
In educational packed absorption columns, you study gas-liquid mass transfer coefficients and effective interfacial area by systematically varying gas and liquid flow rates and measuring resulting pressure drops, liquid holdup, and solute concentration changes. These experimental data, combined with material balances and the two‑film theory, yield the overall volumetric mass transfer coefficient ($K_Y a$). More advanced approaches—leveraging established correlations like those of Onda et al. or chemically enhanced absorption—then allow you to separate this lumped parameter into the liquid‑film mass transfer coefficient ($k_L$) and the effective interfacial area ($a_e$), turning the pilot plant into a true characterization platform.
A packed absorption column pilot plant moves from demonstration to design tool when you collect not just inlet‑outlet concentrations but also hydrodynamic data. By applying material balances and log‑mean driving forces you obtain $K_Y a$; using Onda’s correlations or chemical absorption experiments you can then unravel this into $k_L$ and $a_e$, giving insight that directly feeds industrial column sizing and packing selection.
The Experimental Foundation: What to Measure and Why
To extract mass transfer parameters, the pilot plant must provide a rich dataset under steady‑state conditions. Every variable tells a piece of the story.
Collecting the Essential Data
Gas and liquid flow rates, pressure drop across the packed bed, liquid holdup, and inlet/outlet solute concentrations of both phases are the raw inputs. Accurate measurement of these variables is non‑negotiable—any error propagates directly into calculated coefficients. Flow rates and pressure drop also reveal hydrodynamic regimes, helping you avoid flooding or excessive weeping.
From Data to Driving Force
Using a material balance, you compute the solute absorption rate ($G_A$) from the measured concentration change in the gas or liquid stream. The log‑mean average driving force ($\Delta Y_m$) is calculated from the inlet and outlet gas‑phase mole ratios and the equilibrium relationship given by Henry’s law. With the known packed bed volume ($V_p$), the overall volumetric mass transfer coefficient emerges directly: $K_Y a = G_A / (V_p \cdot \Delta Y_m)$.
Going Deeper: HTU and NTU Analysis
The total packed height ($Z$) is the product of the Height of a Transfer Unit (HTU) and the Number of Transfer Units (NTU): $Z = H_{OG} \times N_{OG}$ (or the corresponding liquid‑side terms). $H_{OG}$ is inversely proportional to $K_Y a$ and directly reflects packing efficiency under your operating conditions. By calculating NTU from inlet/outlet mole ratios and $H_{OG}$ from the column height, students bridge the gap between a raw $K_Y a$ value and the design dimensions of an industrial tower.
Separating the Film Coefficients and Interfacial Area
A single $K_Y a$ value hides the individual contributions of the liquid‑film coefficient and the effective interfacial area. Several strategies let you decouple them.
The Combined Nature of $k_L$ and $a_e$
In physical absorption, the experiment naturally yields the liquid‑film volumetric coefficient $k_L a_e$ rather than $k_L$ alone. Onda et al. developed correlations that express $k_L$ as a function of liquid properties and superficial velocity, and $a_e / a_t$ (the ratio of effective to total packing surface) as a function of liquid flow, surface tension, and packing geometry. By measuring liquid holdup and fitting the variation of $k_L a_e$ with flow rate to the Onda equations, you can back‑calculate both $k_L$ and $a_e$ for a given packing.
The Role of Chemical Absorption
Using a fast, chemically enhanced absorption (e.g., CO₂ in dilute NaOH) confines the reaction to the liquid film. The enhancement factor makes gas‑film resistance negligible, allowing the direct determination of $k_L$ from the measured absorption rate and the known enhancement. Running a physical absorption experiment under identical hydrodynamics then gives the combined $k_L a_e$, and dividing by the now‑known $k_L$ yields the effective interfacial area $a_e$ for that packing‑liquid combination.
The Critical Influence of Packing Surface
Critical surface tension of the packing material governs liquid wetting. Materials with high critical surface tension, such as steel (75 mN/m) or glass (73 mN/m), spread the liquid film more completely, dramatically increasing $a_e$ compared to low‑energy plastics like polyethylene (33 mN/m). Switching packings in the same pilot plant and repeating the $k_L a_e$ measurements lets students observe first‑hand how material choice changes the effective interfacial area—a lesson far more powerful than any textbook table.
Understanding the Trade‑offs
While a pilot packed column is an extraordinary learning tool, it is not a perfect replica of industrial‑scale systems.
Scale and Simplifications
Pilot columns often assume plug flow and constant temperature, while large industrial towers may experience significant axial dispersion and temperature variations. The $K_Y a$ value calculated from only top‑and‑bottom sampling may mask concentration‑dependent mass transfer rates, especially in systems with large changes in solute loading.
Challenges in Separating $k_L$ and $a_e$
Direct measurement of $a_e$ remains one of the most challenging tasks in mass transfer research. Onda’s correlations, while widely used, are empirical and may deviate for novel structured packings or extreme flow conditions. Chemical absorption methods demand well‑characterized reaction kinetics and can be invalid if the reaction is so fast that it occurs in the bulk liquid rather than the film.
Hydrodynamic Limitations
Operating near the loading or flooding points distorts the relationship between flow rates and mass transfer. In these regimes, pressure drop rises sharply, liquid holdup becomes unstable, and the effective interfacial area no longer follows the correlation’s prediction. Students must learn to identify the safe operating window from measured pressure‑drop curves before any coefficient calculation is meaningful.
Making the Right Choice for Your Goal
How you use the pilot plant depends on what you want the experiment to teach.
- If your primary focus is fundamental education: Start with simple CO₂‑water absorption and measure $K_Y a$ at different flow rates. Emphasize the calculation of driving force and the transition to HTU/NTU—this directly reinforces the core chemical engineering design method.
- If your primary focus is packing characterization: Collect steady‑state data over a range of liquid and gas rates, measure holdup and pressure drop, and apply the Onda correlations to extract $k_L$ and $a_e$. Compare multiple packing materials to visualize the effect of critical surface tension on wetting and available area.
- If your primary focus is process scale‑up: Use the pilot plant to determine $H_{OG}$ and flooding limits for your specific gas‑liquid system. Because these values are measured under realistic hydraulic conditions, they can be confidently plugged into the design equation $Z = H_{OG} \times N_{OG}$ for a full‑scale column.
By transforming raw flow and concentration data into fundamental mass transfer parameters, your pilot plant becomes more than a teaching tool—it becomes a miniature design laboratory that bridges the gap between textbook theory and the realities of industrial separation.
Summary Table:
| Parameter | Symbol | Determination Method | Educational & Industrial Value |
|---|---|---|---|
| Overall Volumetric Coefficient | $K_Y a$ | Material balance & log-mean driving force (Henry's Law) | Evaluates overall column separation efficiency |
| Liquid-Film Coefficient | $k_L$ | Onda correlations or fast chemical absorption (CO₂ + NaOH) | Characterizes liquid-side mass transfer resistance |
| Effective Interfacial Area | $a_e$ | Chemically enhanced absorption or Onda equation fitting | Evaluates packing wetting efficiency & surface material impact |
| Height of a Transfer Unit | $H_{OG}$ | Column height divided by Number of Transfer Units ($Z / N_{OG}$) | Directly used for industrial tower sizing & scale-up |
Bring Industrial Reality to Your Laboratory
Are you looking to enhance your chemical engineering curriculum or scale up your separation processes? LABPARK provides state-of-the-art Educational and Vocational Unit Operations Pilot Plants in chemical engineering, bioprocess & biotech, and environmental & water treatment.
Designed specifically for universities, research institutes, and enterprises, our pilot plants—including advanced packed absorption columns—allow students and researchers to master mass transfer, hydrodynamics, and process scale-up with precision.
Contact LABPARK today to request a catalog or discuss your laboratory equipment requirements!
Related Products
- Packed Bed Absorption Educational Unit Operations Pilot Plant
- Absorption and Desorption Educational Unit Operations Pilot Plant
- Multimodal Absorption and Desorption Pilot Plant for Unit Operations Training
- Pressure Swing Adsorption Educational Unit Operations Pilot Plant
- Bench Scale Dual Column Gas Separation and Capture Educational Pilot Plant
People Also Ask
- How Do Flow Regimes Transition in Packed Bed Pilot Plants? Key Scale-up Insights
- How does reactant concentration determine absorption column control? Gas-film vs. dual-film.
- How is the packing height of an absorption column calculated? Master HTU & NTU Concepts
- How does static vs. operating holdup affect pilot plant calibration? Avoid Critical Scale-Up Errors
- Why is counter-current flow selected for gas absorption? Maximize Pilot Plant Efficiency