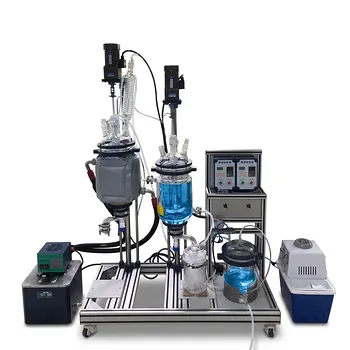
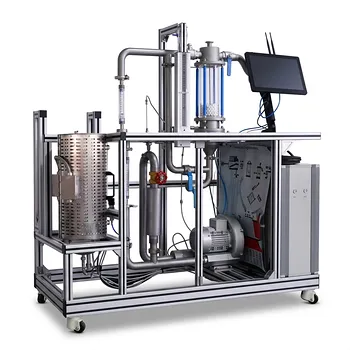
Internal thermal profiles and mass transfer are analyzed by combining embedded temperature measurements with controlled air-side conditions and heat–mass balances. In baking and drying pilot plants, researchers place solid-state thermistor arrays at multiple positions within the porous product or bed, then vary air velocity, temperature, and impingement conditions. The resulting data reveal internal temperature gradients, surface drying behavior, boundary-layer resistance, and the balance between moisture removal and product quality.
Core takeaway: Pilot plants do not treat temperature and moisture movement as separate problems. They map temperature inside the material, control external convection, and use coupled energy and mass balances to determine whether heat transfer, internal conduction, surface vaporization, or external mass transfer is limiting the process.
How the Pilot Plant Represents the Process
External heat transfer supplies the driving force
Hot, circulating air transfers energy to the material primarily through forced convection. Where the product contacts a heated solid surface, conduction also contributes to the heat input.
The surface temperature controls the local vaporization rate. Increasing air velocity or impingement can reduce the external thermal and mass-transfer boundary layers, but the resulting process must still be evaluated against internal resistance.
Internal conduction creates thermal gradients
The porous product does not generally reach a uniform temperature immediately. Heat must conduct from the surface into the interior, and the effective conductivity can change as moisture is removed.
A steep difference between surface and core temperatures indicates that internal conductive resistance is significant. Such gradients are especially important when they affect reaction rates, crust formation, texture, or thermal damage.
Moisture movement is coupled to heat movement
Energy supplied at the surface is used partly to raise the product temperature and partly to vaporize moisture. Moisture then moves from the interior toward the surface and is removed by the surrounding air.
This creates a coupled process: temperature affects vaporization and diffusion, while moisture loss changes the material’s thermal properties and can alter subsequent heat transfer.
How Internal Thermal Profiles Are Measured
Thermistor arrays map temperature through the material
Solid-state thermistors are positioned at selected depths and locations within the porous mass. Their readings are recorded over time to construct temperature profiles across the surface, interior, and thermal zones.
The measurements show how quickly each region responds to the imposed heating conditions. They can also identify delayed core heating, localized hot spots, and differences between product positions.
Time-dependent data are more informative than endpoint data
A final product temperature provides only a limited view of the process. Pilot-scale measurements instead track the full temperature history, including the initial heating period, the transition to significant moisture loss, and the later approach toward thermal equilibrium.
Comparing temperature curves at different depths helps distinguish external heating limitations from internal conduction limitations.
Sensor data require careful interpretation
Thermistors must be calibrated and positioned consistently. Their presence can locally disturb the porous structure or moisture pathway, so measurements should be checked against repeat runs and, where possible, independent surface or outlet measurements.
The array also provides discrete point measurements rather than a continuous temperature field. Researchers therefore use multiple locations and controlled operating conditions to infer the broader internal profile.
How Mass Transfer Mechanisms Are Analyzed
Surface vaporization is linked to air conditions
At the material surface, liquid moisture changes into vapor and enters the surrounding air. The rate depends on the surface condition and on the difference between the moisture concentration or vapor pressure at the surface and in the bulk air.
Air temperature, humidity, velocity, and impingement determine the external driving force and the resistance of the gas-side boundary layer.
Internal moisture movement may be the limiting step
Moisture must travel through the porous structure before it can evaporate at the surface. If this internal movement is slower than surface removal, the process becomes internally controlled even when the external air flow is strong.
Pilot experiments identify this behavior by comparing moisture-loss rates and internal temperature responses while changing air velocity. A large response to air-side changes suggests external resistance; a weak response suggests that internal transport is dominating.
Boundary-layer resistance is evaluated experimentally
Adjustable air-velocity and impingement controls allow the external resistance to be changed independently of the product structure. The resulting change in surface temperature, drying rate, and core temperature helps separate gas-side effects from internal effects.
This approach is more useful than assuming that all observed drying limitations arise from the air flow. In many porous materials, increasing external convection eventually exposes the internal transport resistance.
How Heat and Mass Balances Connect the Measurements
Energy balances quantify heat input and removal
For heat-exchange equipment, the measured heat duty can be related to the overall heat-transfer coefficient through:
[ Q = U A \Delta T_m ]
where (Q) is the heat-transfer rate, (U) is the overall heat-transfer coefficient, (A) is the heat-transfer area, and (\Delta T_m) is the appropriate mean temperature difference, commonly the log mean temperature difference for heat exchangers.
In drying or baking experiments, the energy balance must also account for sensible heating of the product and the energy consumed by moisture vaporization.
Thermal resistance identifies the controlling region
For a heat exchanger, the overall resistance can be decomposed into external convection, fouling, wall conduction, and internal convection. For example, based on the outside tube area:
[ \frac{1}{U_o} = \frac{1}{h_o} +\frac{1}{h_{od}} +\frac{d_o\ln(d_o/d_i)}{2k_w} +\frac{d_o}{d_i}\frac{1}{h_{id}} +\frac{d_o}{d_i}\frac{1}{h_i} ]
Here, (h_o) and (h_i) represent external and internal film coefficients, while the fouling terms account for deposits or contamination.
For a porous baking or drying material, the equivalent resistance is not necessarily represented by this tube-wall equation. Instead, the same analytical principle is applied by separating external convection from internal conduction and moisture transport.
Flow changes provide a practical diagnostic
Changing fluid or air velocity changes the Reynolds number and generally affects convective heat- and mass-transfer coefficients. Measuring the response of (Q), surface temperature, core temperature, and moisture loss provides evidence about which resistance is controlling.
The most useful experiments change one operating variable at a time while keeping product geometry and initial moisture condition as consistent as possible.
How Pilot Plants Analyze Coupled Process Behavior
Temperature zones are compared with moisture-loss zones
A thermal profile is interpreted together with measurements such as product mass, outlet-air temperature, outlet-air humidity, or moisture content. This reveals whether a hot region is also a region of rapid drying or whether heat is reaching the material faster than moisture can escape.
The comparison is essential because a high surface temperature does not automatically mean that the interior is adequately heated or dried.
Axial and radial variations are both important
In continuous or tubular equipment, temperatures and compositions can change along the flow direction. In beds, slabs, or other porous products, gradients can also develop from the surface toward the center.
Pilot plants allow these spatial effects to be measured directly rather than approximated by a single average temperature.
Reaction or biological heat may add a further source
In reactive or biological thermal units, local heat generation can alter the internal temperature profile. Energy balances must then include reaction or metabolic heat in addition to heat supplied by the utility stream.
For tubular reactors, axial balances commonly combine sensible heat transport, wall heat exchange, and reaction enthalpy. The same logic applies to pilot-scale fermentation, where jackets or internal coils remove heat generated by microbial metabolism.
Understanding the Trade-offs
Faster air flow is not always the best solution
Higher air velocity can improve external convection and mass transfer, but it may increase utility consumption, pressure drop, and surface drying. Excessive surface drying can create a crust that further restricts internal moisture movement.
The correct operating condition is therefore a balance between drying rate, energy use, internal uniformity, and final product specifications.
Average temperature can conceal unsafe conditions
A reported average may hide a hot surface, a cold core, or a localized hot spot. These differences matter when product quality depends on a minimum internal temperature or when thermal degradation occurs above a local threshold.
Thermistor arrays and spatially resolved sampling are therefore more informative than relying only on inlet, outlet, or bulk temperatures.
Overall coefficients have limited diagnostic power by themselves
The overall heat-transfer coefficient is useful for comparing equipment performance, but it combines several resistances into one value. A change in (U) alone does not prove whether the cause is air-side convection, internal conduction, fouling, or a change in material properties.
Individual film coefficients, flow conditions, and internal temperature measurements are needed to interpret the result correctly.
Scale-up can change the controlling mechanism
A laboratory product may be limited by external transfer, while a larger pilot product is limited by internal conduction or moisture migration. Geometry, residence time, air distribution, and thermal penetration distance all influence the dominant resistance.
Pilot testing is valuable because it exposes these coupled effects before full-scale equipment is designed.
Making the Right Choice for Your Goal
Use the pilot plant as a controlled diagnostic system, not simply as a smaller production machine.
- If your primary focus is internal temperature uniformity: Use calibrated thermistor arrays at multiple depths and compare surface-to-core temperature differences throughout the operating cycle.
- If your primary focus is drying-rate limitation: Vary air velocity, temperature, humidity, and impingement while recording moisture loss and internal temperatures to distinguish external from internal resistance.
- If your primary focus is heat-exchanger performance: Measure flow rates and temperature differences, calculate (Q), and determine (U) while separately evaluating film coefficients and fouling.
- If your primary focus is scale-up: Build coupled energy and mass balances that include geometry, residence time, internal conduction, external convection, moisture vaporization, and any reaction or metabolic heat.
- If your primary focus is product quality: Optimize for the required moisture profile and thermal history rather than maximizing the instantaneous drying or heating rate.
A well-designed pilot study converts internal temperature and moisture measurements into a clear understanding of which transport resistance controls the process and how to operate it reliably.
Summary Table:
| Analysis focus | Measurements and controls | What it reveals |
|---|---|---|
| Internal temperature | Calibrated thermistor arrays at multiple depths | Core heating, hot spots, and thermal gradients |
| External transfer | Air velocity, temperature, humidity, and impingement | Gas-side heat and mass-transfer resistance |
| Moisture movement | Mass loss, moisture content, outlet-air humidity, and temperature history | Surface evaporation versus internal moisture limitation |
| Heat-transfer performance | Flow rates, temperature differences, heat duty, and overall coefficient U |
Equipment efficiency and changes in thermal resistance |
| Scale-up behavior | Geometry, residence time, air distribution, and coupled energy and mass balances | The controlling mechanism under pilot-scale conditions |
| Product quality | Thermal history, moisture profile, and local temperature limits | Uniformity, texture, safety, and thermal-damage risks |
Are you designing, validating, or scaling up a thermal process? Contact LABPARK to discuss an Educational or Vocational Unit Operations Pilot Plant tailored to your needs. LABPARK provides pilot plants for chemical engineering, bioprocess and biotechnology, and environmental and water-treatment applications. Our systems help universities, research institutes, and enterprises measure internal temperature profiles, evaluate heat and mass-transfer resistance, build reliable energy and mass balances, train operators, and optimize process conditions before full-scale investment.
Related Products
- Comprehensive Multi-Modal Heat Transfer Unit Operations Pilot Plant for Engineering Training
- Dual Mode Heat Transfer Pilot Plant for Unit Operations Training
- Potassium Salt Thermal Dissolution and Crystallization Separation Educational Unit Operations Pilot Plant
- Three-Tube Heat Transfer Educational Pilot Plant for Unit Operations Training
- Hot Filtration Educational Unit Operations Pilot Plant Laboratory System
People Also Ask
- Why is the study of thermal boundary layers and Prandtl numbers critical in heat transfer unit operations pilot plants?
- When is ε-NTU preferred over LMTD in pilot plants? Predict heat exchanger performance without iteration.
- How does regular perturbation analysis aid in predicting nonlinear temperature distributions? Pilot plant insights
- How to configure heat transfer pilot plants for pinch analysis? Teach energy recovery.
- How is the effective thermal conductivity of a dilute particle suspension calculated? A Pilot Plant Guide