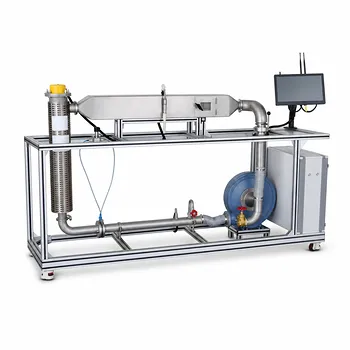
Isothermal VLE data is the cornerstone of reliable thermodynamic modeling in low-pressure distillation design because it dramatically simplifies the correction of experimental results. When you measure vapor-liquid equilibrium at a constant temperature, the pressure correction is almost always negligible at low pressures, allowing you to use the data directly. In contrast, isobaric data (constant pressure) forces you to correct for varying temperature, a step that requires scarce excess enthalpy data and introduces significant uncertainty. This fundamental distinction makes isothermal experiments the preferred choice for generating trustworthy phase-equilibrium parameters in both educational and pilot-plant settings.
Reducing raw VLE measurements to a self-consistent set of thermodynamic parameters is the critical bottleneck in column design. Isothermal data sidesteps the most error‑prone correction—the temperature dependence of the excess Gibbs energy—while isobaric data makes that correction mandatory and often fatally uncertain. The choice is not theoretical pedantry; it is a pragmatic decision that determines whether your design basis is anchored in reliable, low‑uncertainty numbers.
The Fundamental Challenge: Reducing VLE Data to Excess Gibbs Energy
Every distillation model starts from the same question: how non‑ideal is the liquid mixture? The answer is captured in the excess Gibbs energy (gE), which quantifies the deviation from ideal‑solution behavior. To extract gE from experimental T‑x‑y or P‑x‑y data, you must refer all measurements to a single, common thermodynamic state. The way you achieve that reference state is where isothermal and isobaric paths diverge completely.
Why temperature complicates everything
gE is a strong function of temperature. If your experiment keeps pressure constant, the boiling temperature changes with composition—the data are scattered across a temperature range. You cannot feed a set of gE values obtained at different temperatures directly into an activity coefficient model; they are inconsistent.
Why pressure is a forgiving variable
By contrast, gE is remarkably insensitive to pressure, especially at the low pressures typical of atmospheric and sub‑atmospheric distillation. For isothermal data, pressure varies with composition, but the pressure correction to gE depends on the excess volume (vE), which for liquid mixtures is usually tiny. At low pressures, the pressure correction itself is frequently negligible, meaning you can use the raw data almost as is.
The Experimental Advantages of Isothermal Data
The preference for isothermal measurements is not only a correction shortcut; it also unlocks a cleaner experimental method that reduces measurement artifacts.
Indirect vapor composition avoids the biggest sampling error
When you collect isothermal P‑x data, you can obtain the corresponding vapor‑phase compositions indirectly—through thermodynamic consistency tests like Barker’s method or the integration of the coexistence equation. You never need to withdraw and analyze a vapor sample from the equilibrium cell.
Eliminating the condensation and flashing pitfall
Direct vapor sampling at low pressures is notoriously unreliable. Even a slight temperature drop in the sampling line causes condensation of the heaviest components; a tiny pressure drop causes flashing of the lightest. These errors propagate directly into the calculated gE. By measuring only total pressure and liquid composition isothermally, you bypass this entire source of uncertainty.
Impact on Data Correction: A Tale of Two Corrections
The term “data correction” refers to the mathematical reduction that brings all experimental points to a uniform reference state.
Isobaric data requires elusive excess enthalpy
To align gE values from an isobaric run to a single reference temperature, you must integrate the temperature derivative of gE. That derivative is proportional to the excess enthalpy (hE), or heat of mixing. hE data are rarely available for the exact mixture and temperature range you are studying, and estimating them introduces large uncertainties. The correction itself therefore becomes a dominant source of error.
Isothermal data’s pressure correction is almost invisible
The pressure correction in isothermal work uses the excess volume (vE). Liquid‑phase vE values are typically so small that, at low pressures, the correction is within the experimental noise. In practice, researchers often ignore it entirely, removing one whole layer of data manipulation and potential inaccuracy. This is the core reason why isothermal data yield more reliable, less “corrected” model parameters.
Practical Implications for Pilot Plant Design and Education
In a unit‑operations pilot plant—whether for research or for training the next generation of chemical engineers—the choice of VLE strategy directly shapes the quality of the design and the educational takeaway.
Simplified thermodynamic modeling
With isothermal data, students and engineers can directly regress activity‑coefficient parameters without wading through the hE correction minefield. The models they fit are anchored in more trustworthy numbers, meaning the predicted number of theoretical stages, optimal reflux ratios, and energy duties are closer to reality. This eliminates a major hidden source of model‑plant mismatch.
Educational clarity and hands‑on validation
Teaching VLE through isothermal experiments allows students to focus on the core concepts—thermodynamic consistency, the Van Ness test, the meaning of non‑ideality—before confronting the messy reality of temperature corrections. When they later move to pressurized or isobaric equipment, they understand exactly what approximation they are making and why it matters.
Understanding the Trade‑offs
No single experimental strategy is universally superior; isothermal low‑pressure data have limitations that must be respected.
- Temperature‑controlled cell complexity: Precise isothermal operation demands excellent temperature baths and stable control, which can be more challenging than simply boiling a mixture at ambient pressure.
- Low‑pressure assumption boundaries: The “negligible pressure correction” rule breaks down for high‑pressure systems, where excess volumes become significant and the indirect vapor‑composition method must be applied with caution.
- Process‑relevance gap: Many industrial columns operate at constant pressure, so directly measured isobaric VLE might seem more “realistic.” However, the underlying gE model is universal—once you have a reliable model from isothermal data, you can predict the isobaric behavior far more accurately than you could ever measure it with uncorrected isobaric data.
Making the Right Choice for Your Goal
The decision between isothermal and isobaric VLE is not a matter of dogma; it should be guided by what you intend to do with the data.
- If your primary focus is generating trustworthy activity‑coefficient parameters for a column simulation: Prioritize low‑pressure isothermal P‑x data and correct—or safely ignore—the pressure effect.
- If your primary focus is teaching the true meaning of data reduction and the dangers of hidden errors: Start with an isothermal experiment so students experience the cleanest possible path from measurement to model.
- If your primary focus is mimicking a specific industrial constant‑pressure process and you have reliable excess enthalpy data: Isobaric measurements become justifiable, but only if the temperature correction is performed with experimentally validated hE values and full awareness of the propagated uncertainty.
A well‑designed pilot‑plant VLE study finds its power not in how many data points it collects, but in how few unnecessary corrections stand between the measurement and the design decision. In low‑pressure separation work, isothermal data remains the gold standard precisely because it eliminates the most dangerous of those corrections before the modeling even begins.
Summary Table:
| Feature | Isothermal VLE (Constant T) | Isobaric VLE (Constant P) |
|---|---|---|
| Primary Correction | Pressure correction (negligible at low P) | Temperature correction (requires scarce $h^E$ data) |
| Vapor Sampling | Indirectly calculated (avoids sampling errors) | Direct sampling (prone to condensation/flashing) |
| Parameter Accuracy | High; minimal data manipulation needed | Lower; highly sensitive to temperature correction errors |
Bring Industrial-Grade VLE and Unit Operations to Your Lab
Accurate thermodynamic data is the foundation of successful chemical engineering education and pilot-scale research. LABPARK provides state-of-the-art Educational and Vocational Unit Operations Pilot Plants in chemical engineering, bioprocess & biotech, and environmental & water treatment. Designed specifically for universities, research institutes, and enterprises, our systems ensure hands-on, high-precision training and reliable process scale-up.
Ready to elevate your research and curriculum? Contact us today to discuss your laboratory configuration needs with our technical team!
Related Products
- Binary System Vapor Liquid Equilibrium Data Determination Educational Unit Operations Pilot Plant
- Ternary Liquid-Liquid Equilibrium Educational Pilot Plant
- Liquid-Liquid Mass Transfer Coefficient Determination Educational Pilot Plant
- Gallium and Indium Selective Extraction Educational Pilot Plant
- Circulating Wind Tunnel Drying and Convective Heat Transfer Coefficient Determination Educational Pilot Plant
People Also Ask
- How can pilot plants assist in validating VLE models? Bridge theory and physical reality.
- Why Collect Isothermal vs. Isobaric VLE Data? Key Pilot Unit Advantages
- How Do Equations of State Predict VLE in Pilot Plants? Optimize Your Separation Design
- How do intermolecular forces and molecular kinetic energy govern gas liquefaction and vaporization? Explore VLE pilot plants
- For VLE Experiments: Fugacity vs. Activity Coefficient Method Selection Criteria