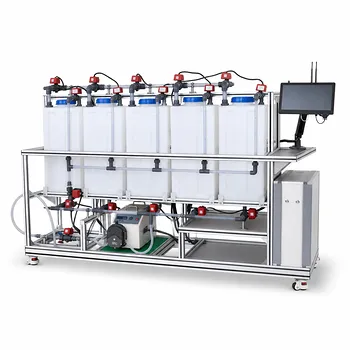
In a chemical engineering pilot plant, electrical conductivity is the most convenient proxy for ionic concentration—yet at higher concentrations, it stops behaving in the straight-line, ideal-dilution way you would expect. This happens because strong electrolytes become subject to intense electrostatic interactions and, in some cases, reversible ion pairing, both of which reduce the number of ions that can actually move in an electric field. The practical consequence is that conductivity scales non‑linearly with concentration, so a sensor reading of 50 mS/cm no longer automatically means two times the concentration of a 25 mS/cm reading. For reliable process monitoring, you must move beyond simple molar‑concentration calibrations and work with activity coefficients and field‑aware correction models.
The core problem is mobility restriction, not de‑ionization. In a concentrated solution, every ion is surrounded by an "ion atmosphere" of opposite charge that creates a drag force, while Coulombic attractions allow short‑lived ion pairs to form. Both effects make the solution behave as if it contains fewer charge carriers, even though complete dissociation is still present. In pilot‑plant monitoring, ignoring this deviation leads to concentration errors that compound across cascade reactions, dilution steps, or quality‑control thresholds.
The Physics Behind Non‑Ideal Conductivity
The Ion Atmosphere and Reduced Mobility
At finite concentrations, a central ion does not move through a uniform electric field alone. According to Debye–Hückel theory, it is permanently enveloped by a statistical excess of counter‑ions—the ion atmosphere.
This atmosphere distorts the local electric field and exerts a physical drag force on the moving ion, lowering its mobility. The higher the concentration, the denser and more structured the atmosphere becomes, and the greater the loss of conductance per mole of ions.
Crucially, this effect is electrostatic, not chemical. The salt remains fully dissociated, but each ion’s contribution to conductivity is reduced. The deviation from ideal, proportional behavior begins at surprisingly low molarities and becomes severe in concentrated multi‑electrolyte pilot streams.
Ion Association and the Vanishing Free Carrier
For electrolytes with divalent or multivalent ions—like magnesium sulfate or calcium chloride—another mechanism kicks in: ion association.
Oppositely charged ions can temporarily pair into neutral, undissociated species simply because their Coulombic attraction overcomes thermal motion. Although the pairing is dynamic, the instantaneous effect is a lower population of free, current‑carrying ions. This directly mimics a drop in concentration and further weakens the conductivity signal per unit of dissolved salt.
In high‑temperature processes above roughly 300 °C, the dielectric constant of water drops dramatically, making ion association even more aggressive. The solution’s conductance can then collapse even while total dissolved solids remain constant, a behavior critical to understand in supercritical water oxidation or high‑temperature electrochemical pilot units.
Consequences for Pilot‑Plant Process Monitoring
The Non‑Linear Concentration–Conductivity Relationship
Because both the ion atmosphere drag and ion association increase with concentration, the standard assumption of a linear conductivity‑concentration relationship fails. A calibration curve built from a single dilute point will systematically underestimate concentration at a higher reading—or, if built on a concentrated point, will overestimate it at low concentrations.
In practice, this means every control decision based on conductivity (dosing, dilution, endpoint detection) inherits a non‑linear error. For a continuous process, the drift can push a reactor outside its design envelope without any alarm being triggered.
To compensate, pilot‑plant engineers must use activity coefficients that relate the apparent (active) ion concentration to the nominal molar concentration. These coefficients are obtained through multi‑point calibration against the specific electrolyte mixture and temperature profile of the plant.
High‑Temperature and Extreme‑Condition Effects
At temperatures beyond 300 °C, the story shifts: the dielectric drop can shrink the Debye length and promote ion pairing to the point where the solution’s conductance falls abruptly, approaching that of a fused salt rather than an aqueous electrolyte.
In these environments, conductivity sensors must be designed with wider electrode gaps and higher‑voltage excitation to maintain a measurable signal. Diagnostic algorithms need to separate concentration changes from temperature‑induced association effects—otherwise the control loop will misread stable operation as a loss of electrolyte or, worse, as fouling.
Real‑Time Kinetics Monitoring: A Sensitive Application
Educational and industrial pilot plants often use conductivity to track reaction progress. Consider the saponification of ethyl acetate:
CH₃COOC₂H₅ + OH⁻ → CH₃COO⁻ + C₂H₅OH
Hydroxide ions (OH⁻) have an exceptionally high molar conductivity. As they are consumed and replaced by acetate ions (CH₃COO⁻), the solution’s conductivity drops steeply, even though the total number of ionic equivalents might remain unchanged.
This makes it possible to compute conversion in real time by relating the measured conductivity κ_t to the initial κ₀ and final κ_∞ values, then extracting the rate constant k. However, the calculation implicitly assumes that the relationship between ion concentration and conductivity is linear over the reaction span—an assumption that breaks down when the initial OH⁻ concentration is high. Without correcting for non‑ideality, the derived kinetic parameters become concentration‑dependent, undermining scale‑up predictions.
Understanding the Trade‑offs and Engineering Pitfalls
Calibration Drift and Sensor Selection
Non‑ideal behavior makes conductivity sensors process‑specific instruments. A probe calibrated on clean NaCl solutions will misread a process stream that contains sulfates, phosphates, or organic ions, even at identical total ionic strength.
Fouling, temperature gradients, and electrode polarization further distort the response. When these are combined with the inherent non‑linearity of concentrated electrolytes, the safe approach is to perform in‑situ, automated two‑ or three‑point calibrations at operating conditions, using grab samples analyzed offline for cross‑validation.
The Membrane‑Solution Conductivity Crossover
In membrane‑based pilot units (electrodialysis, fuel cells, desalination), a surprising inversion takes place: at low external solution concentrations, the ion‑exchange membrane conducts better than the solution because it holds a high density of fixed counter‑ions (up to 3 N). As the feed becomes more concentrated, solution conductivity surpasses that of the membrane because the polymer matrix physically slows down ion mobility relative to free solution.
Recognizing this crossover point is essential for cell design. Operating on the wrong side of it can create large ohmic drops in the solution rather than in the membrane, changing the current distribution and sacrificing efficiency. Process monitoring systems that rely on bulk conductivity readings must interpret this inversion to avoid misdiagnosing membrane fouling or failure.
Making the Right Choice for Your Process‑Monitoring Goal
Your strategy depends on which aspect of the plant you are trying to control. Start by identifying your primary objective.
- If your primary focus is accurate concentration monitoring in a feed or product stream: Abandon single‑point calibrations. Develop a multi‑concentration calibration curve for your exact electrolyte matrix and use activity‑coefficient models to convert measured conductivity to true concentration in real time.
- If your primary focus is high‑temperature operation (supercritical or near‑critical): Select sensors with variable electrode geometries and high‑voltage capabilities. Program your data‑acquisition system to factor in the dielectric‑constant effect on ion association, and include a redundant measurement (e.g., density or refractive index) to independently verify salt content.
- If your primary focus is reaction kinetics (e.g., saponification or neutralization): Validate that the ion exchange (OH⁻ → acetate, etc.) dominates the signal. If reagents are concentrated, measure the conductivity versus conversion relationship experimentally, and use that empirical curve instead of assuming a linear ion‑replacement model.
- If your primary focus is membrane‑based separations: Monitor the ratio of solution conductivity to membrane conductivity as a function of feed concentration. Use this ratio to stay on the optimal side of the crossover and to flag early signs of concentration polarization or membrane scaling.
The non‑ideality that makes concentrated electrolytes tricky is not a flaw—it is a predictable physical phenomenon that, once calibrated out, becomes a powerful, real‑time window into your pilot plant’s chemistry.
Summary Table:
| Cause / Phenomenon | Physical Mechanism | Impact on Process Monitoring |
|---|---|---|
| Ion Atmosphere Drag | Counter-ions create electrostatic drag, reducing ion mobility | Non-linear calibration; underestimation of high concentrations |
| Ion Association | Oppositely charged ions pair into neutral species dynamically | Drop in active charge carriers; severe at temperatures >300°C |
| Reaction Kinetics Shift | Fast ion replacement (e.g., OH⁻ to acetate) in reactions | Kinetic calculations become concentration-dependent if uncorrected |
| Membrane Crossover | Solution conductivity surpasses fixed membrane conductivity | Changes current distribution; risks of concentration polarization |
Are you looking to eliminate measurement errors and optimize your process control? LABPARK provides advanced Educational and Vocational Unit Operations Pilot Plants in chemical engineering, bioprocess & biotech, and environmental & water treatment. Tailored for universities, research institutes, and enterprises, our pilot plants are engineered to handle real-world, non-ideal chemical behaviors with precision.
Ready to elevate your research and training capabilities? Contact us today to find the perfect pilot plant solution for your lab!
Related Products
- Electrolyte Distillation Purification and Formulation Educational Pilot Plant
- Electrolytic Hydrogen Production Educational Unit Operations Pilot Plant
- Water Electrolysis Hydrogen Production and Storage Educational Pilot Plant
- Electrochemical Water Treatment Educational Unit Operations Pilot Plant
- Alkaline Membrane Water Electrolysis Educational Pilot Plant Unit Operations Training System
People Also Ask
- Why does simple distillation yield higher efficiency than flash distillation? Key thermodynamic differences.
- How to Integrate Spectroscopy in Distillation Pilot Plants for Advanced Process Control
- How do batch and continuous distillation pilot plants differ? Master their dynamic behavior
- How does operating pressure influence Methylal/Methanol VLE? Discover its impact on distillation
- Why is the acentric factor important in pilot plants? Fluid property prediction.