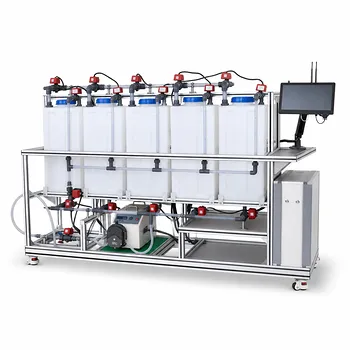
The answer is straightforward: efficiency is defined by how much of the electrical energy you put in actually ends up stored in the hydrogen’s chemical bonds. The core engineering parameters are the thermodynamic energy required (based on the higher heating value of hydrogen, about 285.86 kJ/mol), the actual electrical energy consumed (voltage × current × time), and the resulting voltage efficiency, faradaic (current) efficiency, and overall system efficiency. Chemical engineering pilot plants bring these concepts to life by integrating precise sensors, electrochemical cells, and gas collection systems so students can measure every variable, calculate efficiencies directly, and see the real-world impact of mass transport, kinetics, and thermodynamics.
Calculating water electrolysis efficiency is more than a simple formula—it’s about understanding the gap between ideal thermodynamics and real-world losses. A well-designed pilot plant turns this gap into a tangible learning experience, letting students trace every inefficiency back to phenomena like overpotential, ohmic resistance, and mass transfer limitations.
The Physics of Water Electrolysis Efficiency
The Thermodynamic Baseline: The Minimum Energy You Can’t Avoid
Water splitting requires an energy input equal to the enthalpy of formation of water (ΔH). At standard conditions, that’s approximately 285.86 kJ per mole of H₂ produced. This value represents the total electrical energy demand if you could run a perfect, reversible process.
But thermodynamics alone sets a voltage floor. The reversible cell potential (E_rev) under standard conditions is 1.23 V. Any real cell operates above that because of inevitable irreversibilities. So the first parameter students must grasp is the theoretical energy content—the benchmark against which all losses are measured.
The Electrical Reality: Voltage, Current, Time
Efficiency isn’t calculated from a datasheet; it comes from the actual electrical power integrated over time. The actual energy input is the product of cell voltage (V) , current (I) , and operating time (t) . In a pilot plant, power analyzers log these values continuously, giving students a direct window into how energy demand evolves as conditions change.
A common surface-level question is: “Why not just use a higher current to produce more hydrogen?” The deep answer lies in the fact that increasing current forces the cell voltage upward, meaning each additional joule of hydrogen becomes more expensive, and efficiency drops. The pilot plant makes this visible in real time.
The Two Efficiencies That Multiply into Total Efficiency
Engineers decompose overall electrolysis efficiency into two multiplicative components:
- Voltage Efficiency (η_V): This compares the reversible voltage (1.23 V under standard conditions, adjusted for temperature and pressure via the Nernst equation) to the actual operating cell voltage. Any overpotential—activation, ohmic, or concentration—eats into this number.
- Faradaic (Current) Efficiency (η_F): This measures how successfully the supplied electrons produce hydrogen instead of side reactions or recombination. It’s the ratio of actual hydrogen produced (measured as volume or mass) to the amount theoretically expected from Faraday’s law.
Together, total efficiency = η_V × η_F. A pilot plant that tracks both gas output and electrical input lets students isolate which loss mechanism is dominating.
Polarization Curves: The Fingerprint of an Electrolysis Cell
Polarization curves—plots of cell voltage versus current density—are arguably the most powerful single diagnostic tool. They reveal three distinct loss regimes: activation overpotential dominating at low current densities, ohmic overpotential in the mid-range, and mass transport overpotential at high currents.
In a teaching pilot plant, students generate these curves by varying the load on a PEM electrolyzer while logging voltage and current. They can then connect the shapes directly to electrode kinetics, membrane resistance, and bubble-induced mass transfer effects—exactly the phenomena described in the supplementary references on electrode kinetics and mass transfer.
How Pilot Plants Transform Theory into Practical Competence
From Equations to Measurable Reality
Classroom theory gives students the Nernst equation and Faraday’s laws. A pilot plant gives them the tools to test those equations. Calibrated gas collectors for H₂ and O₂ let students verify Faraday’s laws by showing that the volume of gas evolved is directly proportional to the total charge passed, and that the H₂:O₂ ratio is exactly 2:1.
When students plot gas volume against time for different currents, they immediately see the stoichiometric link. Discrepancies point to gas leakage, recombination, or measurement errors—all valuable lessons in experimental realism.
Integrating Sensors for Complete Energy Audits
Modern pilot plants for green energy education incorporate mass flow meters, temperature sensors, and power analyzers in a single data acquisition system. This means students can:
- Measure the exact power input to the cell.
- Compute the higher heating value energy content of the produced hydrogen using the measured flow rate.
- Calculate instantaneous and cumulative efficiency.
- Observe how efficiency drifts as temperature rises or as bubbles accumulate on electrodes.
This real-time energy auditing moves the lesson from a static calculation to a dynamic process engineering challenge.
Bridging to Industrial Electrochemistry with Fundamental Studies
Beyond basic efficiency, a well-equipped pilot plant can explore the interacting phenomena that determine commercial cell performance. Supplementary references highlight that students must investigate:
- Mass transfer via diffusion and migration in an electric field—how ions move toward electrodes and how concentration gradients form.
- Electric potential distribution between electrode and solution, which affects reaction selectivity.
- Electrode kinetics and surface overpotential—the extra voltage needed to drive the heterogeneous reactions at a practical rate.
- Thermodynamic properties under varying concentration, temperature, and pressure—a direct application of the Nernst equation.
By measuring voltage components (e.g., using a reference electrode) and correlating them with flow visualization, students learn that efficiency is not a single number but a system property governed by transport and kinetics.
Using a Classic Teaching Model to Build Intuition
While PEM water electrolysis is the modern focus, the supplementary references also mention the electrolysis of a zinc chloride solution as a classic transparent model. Visible gas evolution (Cl₂) at the anode and metal deposition (Zn) at the cathode provide an unmistakable, intuitive demonstration of Faraday’s laws: one Faraday (about 96,500 coulombs) deposits one gram-equivalent of zinc.
This model helps students internalize that the quantity of chemical change is proportional to charge, and that the ratio of masses of different products is determined by their equivalent weights. The concept of current efficiency becomes tangible when they weigh the deposited zinc and compare it to the theoretical mass.
Understanding the Trade-offs and Educational Limitations
Real-Time Observation vs. Industrial Realism
Transparent cells and simple electrolyte systems are excellent for visualization but cannot replicate the internal conditions of a modern high-pressure PEM stack. Students must be taught that the commercial world deals with compressed gases, thin membranes, and far higher current densities—all of which introduce additional safety and durability challenges not fully captured in a glass cell.
Measurement Precision and Error Propagation
Pilot plants with integrated sensors still have inherent inaccuracies. Gas collection over water may have vapor pressure corrections; small leaks can skew faradaic efficiency measurements. Part of the learning process is understanding how these errors propagate and how to design experiments that minimize them—another layer of engineering judgment that the equipment teaches.
Safety and Scale
Electrolyzing water produces hydrogen, an extremely flammable gas. Educational pilot plants deliberately operate at small scales and with forced ventilation to keep concentrations below the lower flammability limit. This necessarily limits the throughput and may mask certain mass transport issues that appear only at industrial-scale current densities and bubble management requirements.
Making the Right Choice for Your Educational Goals
When integrating a pilot plant into a curriculum, the equipment and experiments should map to the specific learning outcomes.
- If your primary focus is teaching thermodynamic fundamentals and Faraday’s laws: Start with a transparent classic electrolysis cell (like zinc chloride) where students can see and measure solid deposition and gas evolution. This builds rock-solid intuition about charge-mass equivalence.
- If your primary focus is renewable hydrogen and green energy systems: Choose a PEM electrolyzer with integrated power analyzers, mass flow meters, and a fuel cell load option. Have students generate polarization curves, calculate voltage and faradaic efficiencies across a range of operating points, and compare electrolysis efficiency with fuel cell efficiency as a complete energy cycle.
- If your primary focus is advanced electrochemical engineering: Ensure the pilot plant can accommodate a three-electrode setup (working, counter, reference) to measure overpotentials directly. Include studies on electrolyte flow rate, temperature variation, and pressure effects to link mass transfer and kinetics to the efficiency numbers.
- If your primary focus is data acquisition and process control: Use the pilot plant as a process to be instrumented. Have students design the sensor network, write the data logging code, and perform error analysis on the energy balance, reinforcing that efficiency calculations are only as good as the measurements behind them.
Ultimately, a chemical engineering pilot plant isn’t just a demonstration tool—it’s a miniature industrial process that demands the same rigorous thinking about efficiency, losses, and optimization. When students leave knowing that every millivolt of overpotential and every milliamp of parasitic current has a cost, they’re ready to design the next generation of electrochemical energy systems.
Summary Table:
| Parameter | Formula / Baseline | Key Learning Insight |
|---|---|---|
| Thermodynamic Baseline | $E_{rev} = 1.23\text{ V}$ / $285.86\text{ kJ/mol}$ | The minimum theoretical energy required to split water under standard conditions. |
| Actual Energy Input | $\text{Voltage } (V) \times \text{Current } (I) \times \text{Time } (t)$ | Demonstrates the real-time energy demand and cost of increasing current. |
| Voltage Efficiency (\eta_V) | $E_{rev} / E_{actual}$ | Isolates losses caused by activation, ohmic, and mass transport overpotentials. |
| Faradaic Efficiency (\eta_F) | $\text{Actual } H_2\text{ produced} / \text{Theoretical } H_2$ | Verifies Faraday's Law and identifies losses due to gas leakage or recombination. |
| Total Efficiency | $\eta_V \times \eta_F$ | The ultimate system efficiency showing electrical-to-chemical energy conversion. |
Elevate Your Engineering Curriculum with LABPARK
Are you looking to bridge the gap between complex electrochemical theory and real-world engineering for your students or research team?
LABPARK provides state-of-the-art Educational and Vocational Unit Operations Pilot Plants in chemical engineering, bioprocess & biotech, and environmental & water treatment. Designed specifically for universities, research institutes, and enterprises, our pilot plants feature integrated sensors, real-time data acquisition, and robust safety controls to make teaching thermodynamic energy balances and electrolysis efficiency intuitive and highly effective.
Ready to upgrade your lab's hands-on training capabilities? Contact us today to explore our custom pilot plant solutions!
Related Products
- Alkaline Membrane Water Electrolysis Educational Pilot Plant Unit Operations Training System
- Water Electrolysis Hydrogen Production and Storage Educational Pilot Plant
- Electrolytic Hydrogen Production Educational Unit Operations Pilot Plant
- Electrochemical Water Treatment Educational Unit Operations Pilot Plant
- Electrolyte Distillation Purification and Formulation Educational Pilot Plant
People Also Ask
- How do chemical engineering pilot plants demonstrate electrolysis? Bridge Theory & Industrial Scale
- How do composite membranes affect NaOH production? Key factors for high current efficiency.
- Gap-Electrode vs. Zero-Gap Membrane: Key Design Choices for Water Electrolysis Pilot Plants
- How do alkaline and PEM electrolysis technologies differ in pilot plant operations?
- Why is the selection of electrode materials critical when configuring or operating educational electrolysis pilot plants?