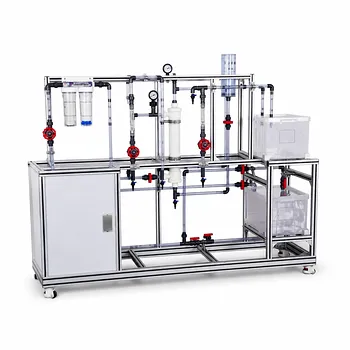
For highly absorbing chemical processes in pilot plants, the cardinal rule is to avoid signal saturation by drastically reducing the optical path length. Standard flow cells with millimeter-scale gaps will absorb virtually all light, leaving the detector blind. Instead, you should select a short-path flow cell with a sample gap as small as 25 µm, which brings the absorbance back down into a measurable, linear range. When the stream’s optical density is so extreme that even a 25 µm gap saturates, switch to an attenuated total reflectance (ATR) immersion probe. And because real pilot-plant streams are rarely clean, always integrate in-line filtration if particulates or bubbles could scatter light and corrupt the baseline.
Pilot-plant monitoring of highly absorbing streams hinges on mastering optical path length. A short-path flow cell (25–200 µm) maintains sufficient light throughput to keep absorbance linear and reliable. For unusually dark or opaque fluids, an ATR probe uses an evanescent wave with an effective path of only a few microns. Where scattering interferences are present, a filtered flow cell prevents false peaks and ensures the data represents true chemical composition rather than optical noise.
Understanding the Path Length Problem in Pilot Plant Monitoring
Why Standard Flow Cells Fail with Highly Absorbing Species
The Beer‑Lambert law dictates that absorbance is directly proportional to both concentration and path length. In a process stream loaded with a strong chromophore, a conventional 10 mm flow cell can push absorbance far above the linear limit of the detector (typically >2 AU). The result is saturation, where the signal flatlines and concentration changes become invisible. For online monitoring, that means you lose the ability to track the very dynamics — breakthrough, reaction endpoint, impurity spike — that justify the instrument’s existence.
Pilot Plant Context: Real‑Time Control Demands Reliable Data
Pilot plants rely on online UV‑Vis to trigger critical operational decisions. In ion‑exchange recovery of nickel catalyst, for example, a continuous scan of the column effluent detects the precise moment of breakthrough. A saturated signal would mask the rising metal concentration, preventing timely flow diversion and risking environmental release or yield loss. The flow cell must therefore deliver a clean, linear response across the entire transient. Any optical shortcut that introduces dead zones or saturation breaks the feedback loop engineers depend on.
Selecting the Right Flow Cell for High‑Absorbance Streams
Short Path Length Flow Cells: The Go‑To Solution
The simplest, most robust way to conquer high absorbance is to shorten the optical gap. Flow cells with path lengths of 25–200 µm are purpose‑built for this. By reducing the path length by a factor of 400 relative to a standard 10 mm cell, you bring even intensely colored streams comfortably into the 0.1–1.5 AU range. Key design points:
- Material choice: Quartz or sapphire windows provide broad UV transparency down to 200 nm and resist aggressive process fluids.
- Flow geometry: A narrow, self‑cleaning flow channel minimizes dead volume and ensures representative sampling of the process loop.
- Pressure and temperature ratings: Pilot‑plant streams can move at 20 bar and 150°C; the cell’s body and seals must be rated accordingly.
Modern short‑path cells are often fiber‑coupled and easily integrated into existing spectrometer setups, making them a pragmatic first option.
When to Escalate to an Attenuated Total Reflectance (ATR) Probe
If even a 25 µm path still absorbs too much light, replace transmission measurement with an ATR probe. An ATR probe guides the light through an internal crystal and measures the evanescent wave that penetrates just a few microns into the process fluid. The effective path length is so short that virtually no stream will saturate it. This makes ATR ideal for:
- Opaque slurries where transmission is impossible.
- Concentrates with absorbance values that would require a mechanically impractical sub‑10 µm gap.
- Hazardous environments where a sealed, single‑port probe minimizes leak points.
Installation typically uses a standard process fitting, but ensure the crystal material (e.g., diamond, ZnSe) matches your chemical environment and spectral range.
Filtered Flow Cells for Particulate and Bubble Management
Catalyst fines, polymer gels, or gas bubbles in the pilot‑plant stream act as scattering centers. Light scattered away from the detector mimics absorption, causing elevated baselines and spurious peaks. A filtered flow cell solves this by placing a cleanable, in‑line filter directly ahead of the optical gap. The filter mesh (often 5–20 µm) traps particles while allowing fluid to pass through the short‑path measurement zone. Some designs also incorporate a passive debubbler to eliminate gas interference. Always combine filtration with a short path length — filtering alone does not fix saturation.
Understanding the Trade‑offs
Signal‑to‑Noise vs. Path Length
Shrinking the path length lowers absorbance, but it also reduces the absolute signal reaching the detector. In extremely dilute regions of a process run, a 25 µm cell may yield an absorbance below 0.01 AU, where noise dominates. This is rarely a problem for highly absorbing streams, but if you need to measure both high and low concentrations with a single cell, consider a variable‑path device or a dual‑range setup. In practice, most pilot‑plant campaigns targeting strongly absorbing species benefit from the shorter gap.
Fouling and Maintenance in Real‑World Plants
A 25 µm gap is inherently more prone to clogging from solids or polymerization than a wider cell. Filtered flow cells mitigate this but add pressure drop and an extra maintenance point. ATR probes can also suffer from crystal fouling, which creates a slowly rising background that must be corrected via automated reference scans. Plan for periodic clean‑in‑place cycles or install a second, bypass‑based cell to allow servicing without shutting down the loop.
Integration with Process Control and Data Acquisition
The flow cell does not operate in isolation. Sudden pressure or temperature swings can shift the spectra of absorbing species; while absorbance spectroscopy is less sensitive to these effects than density‑based measurements, large temperature drifts may require a temperature‑compensated flow cell or referencing at an isosbestic point. Ensure the fiber‑optic interface minimizes stray light and that the spectrometer’s dynamic range matches the chosen path length. In pilot plants where stream composition evolves (as in column breakthrough), correlating the absorbance data with process variables like flow rate and temperature is essential for accurate concentration trending.
Making the Right Choice for Your Pilot Plant Goal
The optimal flow cell configuration depends on what you need the UV‑Vis data to accomplish. Tailor your selection to the primary process challenge:
- If your primary focus is to avoid signal saturation during routine monitoring of a highly colored reactant or product: Start with a short‑path flow cell of 100–200 µm. It delivers excellent linearity without the complexity of ATR and is easily cleaned.
- If your stream is so optically dense that transmission measurement fails (e.g., heavy metal concentrates or opaque suspensions): Deploy an ATR probe. The effective path length of a few microns guarantees a measurable signal, and the probe format simplifies installation.
- If your pilot plant handles slurries, catalyst fines, or gassy feeds that cause erratic absorbance readings: Use a filtered, short‑path flow cell. The integrated filtration protects the optical path, while the short gap prevents saturation — preserving data fidelity for critical decisions like breakthrough detection.
- If your process requires high sensitivity at both high and low concentrations across a single run: Consider a flow cell with variable path length or a dual‑probe setup. This lets you capture the full dynamic range without compromise.
Whichever path you choose, match the wetted materials to your process chemistry, verify the pressure‑temperature envelope, and build in a cleaning strategy from day one. That way, your online UV‑Vis system becomes the pilot plant’s unblinking eye — not its blind spot.
Summary Table:
| Flow Cell Type | Path Length / Feature | Best Used For | Key Advantage |
|---|---|---|---|
| Short-Path Flow Cell | 25 – 200 µm | Highly absorbing/colored streams | Avoids saturation, keeps absorbance linear |
| ATR Immersion Probe | Evanescent wave (~few µm) | Opaque slurries, ultra-dense fluids | Zero transmission risk, handles opaque media |
| Filtered Flow Cell | Integrated 5–20 µm filter | Streams with catalyst fines/bubbles | Prevents light scattering and false peaks |
Optimize your process scale-up with precision-engineered systems. LABPARK provides state-of-the-art Educational and Vocational Unit Operations Pilot Plants in chemical engineering, bioprocess & biotech, and environmental & water treatment. Designed to meet the rigorous demands of universities, research institutes, and enterprises, our solutions ensure accurate online monitoring and control. Contact LABPARK today to discuss your pilot plant needs with our experts!
Related Products
- Orifice and Venturi Flowmeter Calibration Educational Pilot Plant for Fluid Mechanics Laboratory
- Cavitation Phenomenon Demonstration and Analysis Educational Unit Operations Pilot Plant
- Two Phase Flow Pattern Velocity Resistance Measurement Educational Pilot Plant
- Centrifugal Pump Performance and Orifice Flowmeter Calibration Educational Pilot Plant
- Multifunctional Membrane Separation Educational Pilot Plant with Ultrafiltration, Nanofiltration, Reverse Osmosis
People Also Ask
- What is the difference between static and stagnation pressure? Master Pilot Plant Flow Measurement
- How is the hydrodynamic entrance length estimated for high-Re channel flows? Design accurate pilot-plant measurements
- What primary boundary conditions are applied at fluid-solid surfaces when conducting flow experiments on fluid mechanics educational pilot plants?
- How do pilot plants demonstrate siphon pressure variations? Visualizing Bernoulli's Energy Balance
- How do fluid mechanics pilot plants distinguish streamlines from streaklines? See flow visualization in action