Blowdown rate is simply the ratio of what comes in to what can be tolerated.
In any boiler training system, the required continuous blowdown percentage is calculated by dividing the feedwater solids concentration by the maximum allowed boiler water solids, then multiplying by 100. For a feedwater with 85 ppm dissolved solids and a boiler limit of 1250 ppm, the blowdown fraction is 85/1250 = 6.8% of the feedwater flow. Pilot-scale training units make this relationship tangible: students measure real concentrations, compute the blowdown setting, adjust the blowdown valve, and immediately see the impact on steam purity and energy consumption.
The relationship is defined by a simple mass balance: the solids entering with the feed must equal the solids leaving via blowdown, at equilibrium. The blowdown percentage directly reflects how concentrated the boiler water can be allowed to become. In training systems, this calculation is brought to life through measurement, control, and the inevitable trade-off between water quality and energy efficiency.
The Core Relationship: Mass Balance and Cycles of Concentration
The arithmetic behind blowdown is a direct consequence of conservation of mass under steady-state conditions. In a boiler, pure water evaporates as steam, leaving behind all the dissolved and suspended solids. These solids accumulate in the boiler water until a balance is reached where the rate of solids removal equals the rate of solids input.
The Simple Formula
The required blowdown rate, expressed as a percentage of the feedwater flow, is: [ \text{Blowdown %} = \frac{\text{Feedwater solids (ppm)}}{\text{Maximum permissible boiler solids (ppm)}} \times 100 ]
This value is the same as the feedwater flow fraction that must be continuously drained to hold the boiler concentration at the set limit.
Cycles of Concentration
The inverse of that fraction is the cycles of concentration (or blowdown ratio). It describes how many times the feedwater has been concentrated inside the boiler. [ \text{Cycles} = \frac{\text{Boiler water solids}}{\text{Feedwater solids}} = \frac{1}{\text{Blowdown fraction}} ] Using the 6.8% example: cycles = 100/6.8 ≈ 14.7. This means the boiler water is running at nearly 15 times the feedwater concentration.
Why the Formula Matters in Training
The calculation forces students to grasp that blowdown is not a fixed number; it is a function of feedwater quality and boiler operating limits. A dirtier feedwater or a more stringent boiler limit will directly increase the blowdown percentage—and vice versa.
Moving from Equations to Hands-On Demonstration
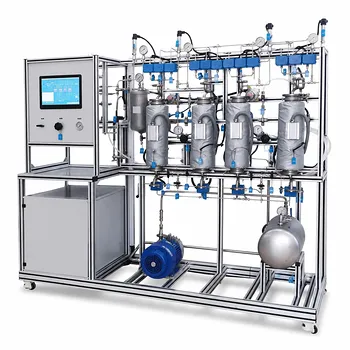
Training units transform abstract equations into a visible, controllable process. Students don’t just solve a problem; they operate a miniature steam-water loop where every adjustment has a measurable consequence.
Measuring the Real-World Parameters
In a pilot plant, students first take samples from the feedwater line and from the boiler water column or continuous blowdown line. They use instruments or bench-top methods to determine the concentration of a key indicator—typically total dissolved solids (TDS), conductivity, or a specific ion like chloride. The measured values are then plugged into the same formula to calculate the target blowdown percentage.
Manipulating the System
The calculated percentage is converted to a physical valve setting on the blowdown line. A rotameter or a calibrated needle valve lets students set the continuous bleed rate. They observe that when the blowdown valve is opened too little, boiler conductivity rises over time; when it is opened too much, the boiler struggles to maintain level and energy losses increase.
Visualizing Continuous vs. Intermittent Blowdown
Pilot units often include both a continuous blowdown take-off (usually from the upper water level where dissolved solids concentrate) and a bottom drain for intermittent blowdown. The continuous bleed maintains a steady chemical equilibrium. Periodic short “puff blows” from the bottom demonstrate the removal of settled sludge and suspended solids that are not handled by continuous surface blowdown alone.
Measurement Techniques and Their Pitfalls
Not all ways of measuring solids are equal, and training systems are an ideal place to teach this.
The Chloride Approach
One classic method is to measure chloride concentrations in feedwater and boiler water and compute blowdown as (feedwater chloride / boiler water chloride) × 100. Chloride is used because it is conservative—it doesn’t precipitate or decompose under boiler conditions. The secondary reference highlights this: the blowdown ratio is the chloride ratio, and percent blowdown is its reciprocal.
Why the Mohr Method Can Mislead
The Mohr titration (silver nitrate with chromate indicator) is simple and educational, but it systematically yields lower chloride readings for feedwater and higher readings for boiler water compared to a more accurate potentiometric method. This error inflates the calculated blowdown ratio and underestimates the necessary blowdown percentage, potentially leading to an overconcentration of the boiler and scale risk. Training systems can demonstrate this by comparing Mohr results with those from a conductivity meter or mercuric nitrate titration.
Preferred Methods for Educational Clarity
For reliable control in a pilot plant, conductivity measurement is often the preferred proxy for TDS. It is instantaneous, non‑destructive, and easy to log. Alternatively, mercuric nitrate titration for chloride gives sharper endpoints and more accurate blowdown calculations, making it a frequent choice in rigorous laboratory exercises. The lesson is clear: the quality of the measurement directly determines the safety and efficiency of the blowdown control.
Understanding the Trade-offs
No discussion of blowdown in a training context is complete without confronting the energy implications. Every litre of hot boiler water blown down is energy that must be replaced by heating cold make‑up water.
Water Quality vs. Energy Cost
There is an unavoidable trade-off:
- Low blowdown rate (high cycles) saves fuel and water but increases the risk of scale, carryover, and corrosion as solids build up.
- High blowdown rate keeps the boiler extremely clean but wastes hot water and the fuel used to heat it.
Students can quantify this by measuring the steady-state energy input to the boiler at different blowdown settings and calculating the heat lost in the blowdown stream.
The Limits of Feedwater Treatment
In an ideal world, feedwater would be so pure that blowdown could approach zero. In training units, this becomes an economics lesson: better external treatment (softening, reverse osmosis, deionization) reduces feedwater solids and therefore reduces the required blowdown. Students can deliberately switch feedwater sources or pre‑treatment methods and watch the required blowdown percentage drop—while noting the capital and operating cost of that upstream improvement.
Intermittent Blowdown and Unseen Losses
The puff blows for sludge removal are hard to meter precisely, yet they add to total water and energy losses. Training exercises can include estimating the additional blowdown contribution from these bottom blows and integrating it into the overall management strategy.
Making the Right Choice for Your Training or Operational Goal
The calculation is only the beginning; the real value comes from linking the number to a control strategy that matches the system’s constraints.
- If your primary focus is teaching the fundamentals of mass balance: Stick to the direct (feedwater solids / boiler limit) calculation using gravimetric TDS or conductivity. Have students adjust blowdown manually while logging boiler TDS over time to verify the equilibrium.
- If your primary focus is analytical chemistry and method validation: Use chloride titrations and compare Mohr, potentiometric, and mercuric nitrate results. Calculate blowdown from each and discuss which method gives the most reliable guidance for boiler safety.
- If your primary focus is energy management and operational economics: Instrument the blowdown line with a flow meter and thermocouple. Require students to compute the heat recovery potential of a blowdown flash tank and evaluate how increasing cycles of concentration saves fuel but raises chemical treatment costs.
- If your primary focus is full‑system integration: Change feedwater quality (spike with salt, soften, etc.), recalculate the required blowdown, implement both continuous and intermittent strategies, and measure steam purity via a condensate conductivity meter. This closes the loop from input water to steam quality.
Ultimately, the relationship between feedwater solids and blowdown is a simple ratio—but mastering it in a training system means understanding that ratio is a dynamic decision point, balancing water chemistry, equipment protection, and energy efficiency in real time.
Summary Table:
| Key Concept | Formula / Method | Educational Significance |
|---|---|---|
| Blowdown % | (Feedwater Solids / Max Boiler Solids) × 100 | Demonstrates mass balance calculations in real-time. |
| Cycles of Concentration | Boiler Solids / Feedwater Solids | Shows how many times feedwater concentrates inside the boiler. |
| Continuous Blowdown | Steady surface bleed based on conductivity | Teaches steady-state chemical equilibrium control. |
| Intermittent Blowdown | Periodic bottom "puff blows" | Teaches sludge removal and total energy loss management. |
Bring Boiler Water Treatment Concepts to Life
Looking to enhance your training program or research capabilities with hands-on learning systems? LABPARK provides high-quality Educational and Vocational Unit Operations Pilot Plants in chemical engineering, bioprocess & biotech, and environmental & water treatment.
Specially designed for universities, research institutes, and enterprises, our pilot plants make complex thermodynamic and mass balance principles tangible. Help your students and operators master real-world chemical controls—contact LABPARK today to discover the perfect pilot plant solution for your lab!
Related Products
- Electrochemical Water Treatment Educational Unit Operations Pilot Plant
- Alkaline Membrane Water Electrolysis Educational Pilot Plant Unit Operations Training System
- Multi-Modal Distillation Unit Operations Training Pilot Plant
- Multi-Functional Membrane Separation Educational Pilot Plant for Unit Operations Lab
- Two-Dimensional Fluidization Hydrodynamics Educational Pilot Plant for Unit Operations Training
People Also Ask
- What design features do educational electrochemical pilot plants utilize to manage gas liberation and water loss?
- How can unit operations pilot plants show lead-acid concentration vs state of charge? Real-time monitoring guide.
- How do educational electrochemical pilot plants scale up electrolysis? Master industrial engineering.
- How to Estimate Sulfate in Water Treatment Pilot Plant Deposits: Gravimetric Guide
- How can foaming be managed during steam generation experiments in water treatment unit operations pilot plants? Tips