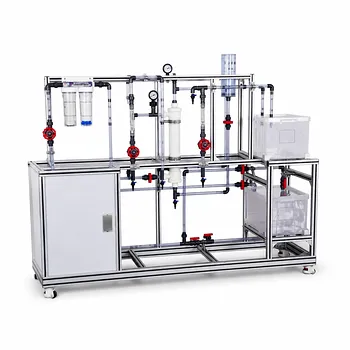
Vocational training pilot plants measure a PEM fuel cell's efficiency and U/I characteristics by using a controlled experimental circuit. The core setup involves an adjustable electrical load to draw power from the cell, with a voltmeter and ammeter capturing real-time data. By manually varying the load's resistance to change the current and recording the resulting voltage drop, students generate the polarization curve—the definitive signature of fuel cell performance—and then calculate efficiency by comparing the electrical work done to the theoretical energy content of the hydrogen consumed.
Understanding an electric motor is simple: you apply power and it spins. Understanding a fuel cell is about managing a dynamic chemical-to-electrical conversion. The surface need is plotting a U/I curve, but the deep need is visualizing the invisible inefficiencies—the activation losses and ohmic resistances inside the membrane—that define how "good" a fuel cell truly is.
Building the Measurement Circuit
Before performance can be quantified, the fuel cell must be integrated into a system that allows for precise control and observation. In a pilot plant setting, this is a direct, hands-on circuit design task.
The Core Components: Load, Voltmeter, and Ammeter
The primary instrument is an adjustable electrical load (potentiometer or rheostat). This acts as a variable sink for the electrical energy the fuel cell produces. A voltmeter is connected in parallel with the cell's terminals to measure the potential difference, and an ammeter is connected in series to measure the flow of charge (current).
The Hydrogen and Oxygen Supply
In an educational pilot plant, the fuel cell is often integrated into a closed-loop system. Hydrogen and oxygen gases, which were previously generated and stored via an electrolyzer, are supplied to the anode and cathode of the PEM fuel cell. This direct connection between gas storage and the measurement rig is what completes the practical loop for students, linking energy storage to power generation.
Decoding the U/I Characteristic Curve
The U/I curve is not just a line on a graph. It is a diagnostic tool that reveals the internal physics of the fuel cell. Plotting this curve is the primary hands-on activity for understanding performance.
The Experimental Process
The measurement process is methodical. The adjustable load is initially set to a high resistance, limiting current flow. This gives the Open Circuit Voltage (OCV), which is typically around 0.9-1.0V for a single cell, less than the theoretical 1.23V due to internal losses. The load resistance is then decreased in steps, forcing the current to increase into the typical operating range, such as 0.1 A to 0.2 A. At each step, the stable voltage is recorded.
Interpreting the Three Loss Regions
Once plotted, the curve reveals three distinct regions of efficiency loss, connecting abstract theory to tangible data:
- Activation Losses: The sharp initial voltage drop at very low current densities. This represents the energy needed to break and form chemical bonds at the catalyst surface.
- Ohmic Losses: The linear, sloping drop in the middle of the curve. This is the dominant loss in the 0.1 A to 0.2 A testing range and is caused by resistance to ion flow in the PEM membrane and electron flow through the electrodes.
- Mass Transport Losses: The final sharp voltage decay at high current densities, where the rate of gas supply to the catalyst cannot keep up with the reaction rate.
Calculating True Electrical Efficiency
Plotting the curve shows how performance changes, but calculating efficiency answers the question of how effective the entire conversion process is. This is the critical calculation that connects electrical measurements to chemical principles.
The Energy-In vs. Energy-Out Equation
The calculation is a practical application of thermodynamics. The electrical energy output is straightforward: Energy = Voltage × Current × Time. The key measurement is the theoretical input energy. Students measure the volume of hydrogen consumed from the storage tank during the timed test and calculate its chemical energy using hydrogen's Heating Value. The final efficiency is the ratio of these two numbers.
Why PEM is a Benchmark for Education
This measurement method directly demonstrates why reformate/hydrogen PEM systems, with their typical 45% stack electrical efficiency, are favored for vocational training over alternatives like Direct Methanol Fuel Cells (DMFCs). The PEM's higher power density allows for a more compact and responsive experimental setup, making the cause-and-effect relationship between load resistance, voltage, and hydrogen consumption immediate and intuitive for a student to grasp.
Understanding the Trade-offs
A definitive measurement of a pilot plant's fuel cell must acknowledge what the standard U/I curve and efficiency calculation cannot tell you.
The Limitation of a Steady-State Measurement
The described method measures stack efficiency under stable conditions. It does not directly capture durability or dynamic response. A pilot plant's steady-state U/I curve won't reveal catalyst degradation rates over hundreds of hours or how quickly the fuel cell responds to a sudden power surge. These require long-term durability tests and transient load cycling, which are often separate experiments in a full vocational curriculum.
The Hidden Balance-of-Plant Load
The electrical efficiency calculation compares output to the hydrogen's energy content. It often ignores the parasitic power required to run the fuel cell's auxiliary systems—air compressors, cooling pumps, and control electronics—which are essential for a complete power system. The measured stack efficiency is always higher than the net system efficiency a real-world power plant would achieve.
Making the Right Choice for Your Goal
Your approach to these measurements depends on the educational objective. The same pilot plant can teach the physics of electrochemistry or the pragmatism of systems engineering.
- If your primary focus is teaching fundamental electrochemistry: Emphasize the hands-on plotting of the U/I curve with the adjustable load, asking students to calculate activation and ohmic loss contributions from the graph.
- If your primary focus is renewable energy systems engineering: Expand the experiment to measure the total energy consumption of the entire pilot plant (including the electrolyzer and gas storage) and compare it to the fuel cell's output to calculate a true round-trip efficiency.
- If your primary focus is material science evaluation: Modify the experiment to test the same stack under controlled, elevated temperature and humidity conditions to observe their impact on membrane conductivity and the shape of the ohmic loss region.
Your goal is to make the invisible visible, turning a silent electrochemical reaction into a clear story of voltage, current, and the constant pursuit of efficiency.
Summary Table:
| Loss Region | Cause of Inefficiency | Impact on U/I Curve |
|---|---|---|
| Activation Losses | Energy needed to break/form chemical bonds | Sharp initial voltage drop at low current |
| Ohmic Losses | Resistance to ion/electron flow in membrane | Linear, sloping drop in the middle range |
| Mass Transport Losses | Gas supply cannot match high reaction rate | Sharp voltage decay at high current densities |
Enhance Your Lab's Hands-On Engineering Training
Bring real-world technology into your classrooms and research facilities. LABPARK designs and supplies premium Educational and Vocational Unit Operations Pilot Plants across chemical engineering, bioprocess & biotech, and environmental & water treatment.
Whether you are a university, research institute, or enterprise, our systems help students visualize complex thermodynamics and electrochemical reactions with precision.
Ready to upgrade your lab? Contact LABPARK today to discuss your custom training requirements!
Related Products
- Polymerization Granulation and Pellet Processing Educational Unit Operations Pilot Plant
- Ethyl Acetate Synthesis Unit Operations Pilot Plant for Practical Training
- Multi Pump Fluid Transport Process Piping Unit Operations Training Pilot Plant
- Bio-fermentation Ethanol Production Practical Training Unit Operations Pilot Plant
- Multi Functional Membrane Crystallization Educational Unit Operations Pilot Plant
People Also Ask
- How to configure a polymerization pilot plant for molecular weight control? Key Setup Guide
- How do educational unit operations pilot plants bridge theory and industrial process development? Hands-On Learning
- How do educational unit operations pilot plants bridge theory and design? Bridge the Engineering Gap
- How do educational unit operations pilot plants address safety and waste management when scaling up?
- How do unit operation requirements differ between traditional chemical processes and bioprocesses? Build Better Pilot Plant Curricula