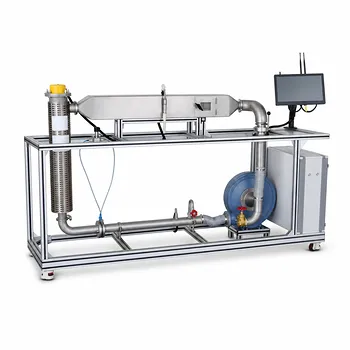
Software simulations of flash vaporization are not a substitute for physical pilot plants—they are the prerequisite that turns a lab exercise into a true scientific investigation. By modeling vapor-liquid equilibrium (VLE) ahead of time, students can predict theoretical vapor/liquid ratios, component splits, and phase boundaries for multi-component mixtures. When they then operate the physical flash distillation pilot plant under identical conditions, they directly compare experimental yields against thermodynamic predictions, transforming abstract concepts into a concrete lesson on process control and separation efficiency.
Flash simulations act as a digital twin, giving students a risk-free sandbox to explore how pressure, temperature, and composition dictate phase behavior. When paired with pilot plant operation, this loop of prediction and validation cements the link between thermodynamic theory and real-world separations, while teaching the critical skill of diagnosing deviations.
From Theory to Reality: The Predictive Engine
The Digital Twin Concept in Flash Distillation
Software that models flash vaporization creates a digital twin of the pilot plant’s separation drum. Students input feed composition, pressure, and temperature to instantly calculate dew points, bubble points, and the resulting vapor fraction ($V/F$). This prediction provides a target—before anything leaves the feed tank, the expected equilibrium compositions ($x_i, y_i$) are known, anchoring the entire experiment.
Calculating the Feasible Two-Phase Window with DPTS and BPTS
A simulation’s most immediate practical value is mapping the two-phase operating window. By computing DPTS ($\sum Z_i / K_i$) and BPTS ($\sum Z_i \cdot K_i$), students can see that a vapor-liquid equilibrium only exists when both values exceed 1. If DPTS < 1, the system is all vapor; if BPTS < 1, it’s all liquid. This eliminates guesswork and ensures the pilot plant’s temperature and pressure setpoints are physically capable of producing a separation before the first run.
Bridging the Gap: Comparing Simulation Outputs with Pilot Plant Data
Once the physical flash drum is operated with the predicted parameters, the real learning begins. Students measure actual vapor/liquid ratios and component concentrations, then overlay them on the simulation’s results. Discrepancies become teaching moments: a lower-than-expected vapor fraction might point to heat losses, while a shift in composition could reveal non-ideal phase behavior. This direct comparison deepens understanding of both thermodynamic models and practical process control.
Enhancing Learning Through Pre-Lab Planning and Safety
Setting Safe and Efficient Operating Conditions
Simulations let students test extreme conditions without consuming utilities or risking a pressure excursion. By modeling adiabatic or isothermal flashes, they can predict the temperature drop across a throttling valve and verify that the separator’s design pressure is not exceeded. Instructors can require that a validated simulation run be submitted before any physical operation, reinforcing a safety- and efficiency-first mindset.
Minimizing Waste and Maximizing Experimental Value
A pilot plant’s feedstock and energy are finite. Running a flash drum in a single-phase region because of an incorrect temperature setting wastes both. Using simulations to lock in a two-phase condition — and even to explore multiple operating points digitally — lets students dedicate physical lab time to only the most instructive runs. This turns a three-hour lab slot into a dense, data-rich experience rather than a trial-and-error hunt for vapor.
Understanding the Trade-offs
Why a Screen Can’t Replace a Pump
Simulations rely on thermodynamic models and property correlations that may not perfectly capture the real mixture. A flash calculation using ideal K-values will give mis-leading results for a highly non-ideal mixture. The software is only as good as its underlying equations of state, and it cannot predict mechanical issues like entrainment or fouling. The physical plant provides the essential reality check — the noise, the heat losses, and the dynamics that no simulation replicates.
The Risk of a “Black Box” Mindset
If students merely plug numbers into a software block without understanding the underlying flash algorithms or the concept of equilibrium stages, the simulation becomes a black box. The complement works only when the curriculum explicitly teaches the manual flash calculation sequence. The software should accelerate the computation, not bypass the fundamental reasoning about fugacity, Raoult’s law, and phase stability.
How to Integrate Simulations into Your Curriculum
After a brief exploration of the simulation environment, tie it directly to the physical pilot plant exercise. Use the following goals to structure assignments:
- If your primary focus is building thermodynamic intuition: Ask students to predict how changing the feed composition or pressure shifts the vapor fraction and then verify that trend on the pilot plant, focusing on the “why” behind the data.
- If your primary focus is teaching process troubleshooting: Intentionally introduce a mismatch between the simulation and actual operation — such as an assumed ideal K-value — and have students identify the source of the deviation from the pilot plant readings.
- If your primary focus is maximizing safety and experimental efficiency: Require a DPTS/BPTS printout for two or three proposed operating points before the lab; only approve the runs that fall within the two-phase region and respect equipment pressure ratings.
- If your primary focus is bridging to advanced separations: Use the flash simulation as a prelude to a full distillation column run, showing how the flash drum pre-separates light ends and reduces the column’s thermal load, creating a direct link to the wider unit operations sequence.
The laboratory becomes an iterative loop — simulate, operate, compare, refine — that mirrors how professional chemical engineers approach separation design. By weaving flash vaporization simulations into every stage of the pilot plant experiment, you give students not just a recipe to follow, but a framework for thinking that will serve them far beyond the teaching lab.
Summary Table:
| Feature | Software Simulation (Digital Twin) | Physical Pilot Plant |
|---|---|---|
| Primary Role | Predictive engine & risk-free sandbox | Real-world validation & process control |
| Key Outputs | Theoretical V/F ratios, dew/bubble points | Actual yields, temperatures, concentrations |
| Limitations | Misses mechanical issues (fouling, heat loss) | High utility use, risk of off-spec runs |
| Learning Value | Tests extreme conditions safely | Diagnoses deviations & non-ideal behaviors |
Elevate Your Chemical Engineering Curriculum with LABPARK
Ready to bridge the gap between thermodynamic theory and hands-on practice? LABPARK provides state-of-the-art Educational and Vocational Unit Operations Pilot Plants in chemical engineering, bioprocess & biotech, and environmental & water treatment. Tailored for universities, research institutes, and enterprises, our physical pilot plants perfectly complement digital twins to deliver a comprehensive, industry-ready training experience.
Contact LABPARK Today to request a custom quote and upgrade your laboratory infrastructure.
Related Products
- Supercritical High-Gravity Flash Evaporation Educational Unit Operations Pilot Plant
- Rising and Falling Film Evaporation Educational Unit Operations Pilot Plant
- Binary System Vapor Liquid Equilibrium Data Determination Educational Unit Operations Pilot Plant
- Two-Dimensional Fluidization Hydrodynamics Educational Pilot Plant for Unit Operations Training
- Circulating Wind Tunnel Drying and Convective Heat Transfer Coefficient Determination Educational Pilot Plant
People Also Ask
- How is the heat transfer area calculated for an evaporation unit operations pilot plant during experimental design? Guide
- How to select educational evaporator pilot plants for thermal & scaling solutions? Complete Guide
- How to Connect Benchtop Evaporation to Pilot Plants in Chemical Engineering Education
- How are Dühring plots applied in evaporation pilot plants? Practical guide to boiling point prediction
- What is the practical significance of Kb in pilot plant evaporation? Master process design.