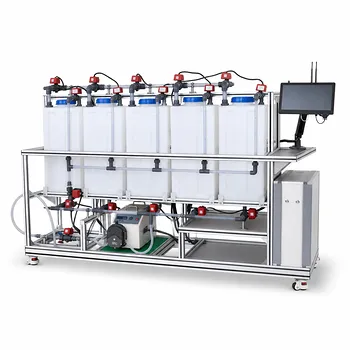
Selectivity is the silent victim of mass transfer resistance—and it often goes unnoticed until a pilot plant reveals the damage. Chemical engineering educational pilot plants, particularly those built around catalytic fixed‑bed reactors, let students and researchers manipulate catalyst particle size, flow rate, and temperature to systematically shift a reaction network from kinetic control to diffusion control. By measuring the resulting product distribution online, users can experimentally validate how diffusional limitations lower the yield of desired intermediates, change apparent activation energies, and disguise true reaction orders—all while connecting classic models like the Thiele modulus and Wheeler‑Weisz criterion to real, tangible data.
The real lesson from a pilot plant isn’t simply that diffusion limits exist—it’s that they mask intrinsic kinetics, cut selectivity toward valuable intermediates, and can halve the yield you expected from kinetic equations. Running experiments across different catalyst sizes lets you quantify the Wheeler‑Weisz modulus, pinpoint the moment mass transfer takes charge, and learn how to design reactors that stay in the kinetic‑safe zone.
How Diffusional Resistance Attacks Selectivity and Yield
The Kinetic‑to‑Diffusion Transition in One Picture
In a porous catalyst, the Thiele modulus (ϕ) compares the reaction rate to the diffusion rate.
When ϕ is small, the effectiveness factor (η) stays near 1 and the process is kinetically controlled.
When ϕ becomes large, η drops sharply—the reaction only “sees” a fraction of the catalyst surface, and the apparent kinetics change dramatically.
A pilot plant makes this transition visible: changing the catalyst particle size alters the diffusion path length, while temperature changes adjust the reaction rate constant relative to the diffusion coefficient.
Why the Desired Intermediate Gets Devoured
Consider a consecutive reaction A → B (desired) → C (undesired).
In the kinetic regime, the reaction mixture moves through the particle quickly enough that B exits before it can over‑react.
When diffusional limitations are strong, B is forced to linger inside the catalyst pores.
Its local concentration stays high, giving the second reaction time to consume it.
The result: overall yield of B plummets, even if the conversion of A looks high.
Turning the Pilot Plant into a Diagnostic Lab
Instrumentation That Quantifies the Damage
Modern unit‑operations pilot plants are outfitted with online conductivity meters, pressure transmitters, and flowmeters.
Students can track real‑time changes in physical properties—gas generation, color, pressure—to calculate fractional conversion (f), yield (Y), and selectivity (S).
For example:
- f = moles reacted / moles fed
- Y = moles desired product formed / theoretical maximum from limiting reactant
- S = moles desired product formed / moles undesired product formed
These direct measurements turn abstract theory into a quantitative “diffusion damage report.”
The Three Experimental Levers
The pilot plant gives you three clear knobs to manipulate the reaction‑to‑diffusion balance:
- Catalyst particle size (L). Reducing L shortens the diffusion path and lowers the Thiele modulus. This is the most direct way to slide the system from the diffusion‑controlled regime into the kinetic‑controlled regime.
- Flow rate (external mass transfer). Increasing flow rate reduces film resistance at the particle surface, improving selectivity in some cases. However, it also changes the residence time in the reactor, so interpretation must be careful.
- Temperature. Raising the temperature increases the intrinsic rate constant (k) exponentially, which can push a reaction into the diffusion‑controlled zone even on a fixed catalyst. By running temperature‑ramp experiments, you can watch the effectiveness factor collapse in real time.
The Wheeler‑Weisz Modulus: A Single Number That Tells the Whole Story
From the measured macro‑kinetic rate (rₐ), catalyst size (L), surface concentration (cₐ_S), and effective diffusivity (Dₑ), students can calculate the Wheeler‑Weisz modulus (Mw):
Mw = rₐ · L² / (cₐ_S · Dₑ) = φ² · η
The pilot plant allows you to vary L independently and measure rₐ for each particle size, then check where the system sits:
- Mw < 0.15 → internal diffusion resistance is negligible (η ≈ 1). You are measuring true kinetics.
- Mw > 7 → strong internal diffusion limitations dominate. The observed rate is diffusion‑masked.
By plotting η vs. Mw (or vs. particle size), students see the smooth transition that textbooks describe—and learn why a reactor that works perfectly in the lab can fail at scale.
How Diffusion Disguises Kinetic Parameters
When diffusion control takes over, two classic signatures appear, and the pilot plant can capture both:
- Apparent activation energy halves. In the kinetic regime, an Arrhenius plot gives the true intrinsic Eₐ. In the strong‑diffusion regime, the apparent Eₐ drops to roughly Eₐ / 2 because both reaction and diffusion contribute to the temperature response.
- Apparent reaction order shifts toward unity. A true second‑order reaction will behave as 1.5‑order when diffusion‑limited. A first‑order reaction stays first‑order, but for truly different orders the shift is unmistakable in the pilot‑plant data.
To demonstrate, operators run the same reaction on small particles (kinetic‑controlled) and large particles (diffusion‑controlled). The slope change in the Arrhenius plot—and the trend in apparent order—become tangible, not just equations in a notebook.
Temperature Profiling: Outsmarting the Trade‑Off
In parallel reactions where the desired path has a lower activation energy (E₁ < E₂), low temperatures favor selectivity but produce painfully slow rates.
A pilot plant with programmable temperature control allows a dynamic solution: start at a low temperature to keep selectivity high, then ramp the temperature upward as the reactant concentration declines.
This temperature‑profiling strategy can recover yield that diffusion‑limited, isothermal operation would destroy.
Students can test the profile in a plug‑flow or batch pilot reactor and compare the final product distribution to a constant‑temperature baseline—seeing firsthand how time‑resolved thermal management counters the diffusional selectivity loss.
Understanding the Trade‑offs and Common Pitfalls
The Masked Kinetics Pitfall
The greatest risk is mistaking diffusion‑disguised kinetics for the real thing.
If you collect data on large catalyst particles without checking Mw, you will underestimate the true activation energy and misinterpret the reaction order.
Any scale‑up based on these false numbers will deliver a reactor that underperforms—often with yield‑killing consequences.
Reaction Yield ≠ Overall Plant Yield
In the pilot plant, it’s tempting to stop at the reactor’s chemical yield.
But a low single‑pass yield (due to diffusion‑driven selectivity loss) forces downstream separation loops to recycle unreacted material.
A student who only looks at reactor numbers misses the full picture:
Overall plant yield = chemical yield × separation recovery efficiency.
The pilot plant can connect these dots by linking the effluent composition directly to the energy and capital cost of separation units.
The Particle‑Size Trade‑Off
Small catalyst particles kill diffusion limitations, but they also create high pressure drop in a packed bed.
This adds compressor costs and mechanical complexity.
A well‑designed pilot‑plant exercise lets students measure both the yield improvement (small particles) and the pressure‑drop penalty (large particles) to find the economic sweet spot—the classic reactor‑engineering compromise.
External Mass Transfer Also Bites
Even if internal diffusion is eliminated, a stagnant film around the particle can become rate‑limiting.
Low flow rates magnify this external mass‑transfer resistance, which can further reduce selectivity.
Pilot plants allow you to map the effect by running the same small particles at different flow rates and observing where the exit composition plateaus—a clear signal that film resistance has been overcome.
Making the Right Choice for Your Educational Objective
How you design your pilot‑plant exercise depends on the core goal you want to teach.
- If your primary focus is teaching fundamental reaction engineering: Use catalyst particle‑size variation as the main variable. Calculate η and Mw for each run, and build the classic η‑vs‑φ plot. This cements the Thiele‑modulus concept better than any simulation.
- If your primary focus is optimizing yield in complex reaction networks: Run a consecutive reaction scheme in a fixed‑bed pilot plant. Vary temperature and flow to generate selectivity‑vs‑conversion curves, and highlight the yield penalty that appears as the system drifts into diffusion control.
- If your primary focus is scale‑up and process economics: Combine particle‑size experiments with pressure‑drop measurements. Let students compute the cost of lost yield from diffusion versus the cost of higher pressure drop, then decide on an optimal commercial particle size.
- If your primary focus is gathering intrinsic kinetic data for modeling: Always begin with the smallest available catalyst particles and verify that Mw < 0.15. If that’s not possible, use the pilot‑plant data to calculate η and correct the apparent kinetics back to intrinsic values—teaching the critical art of de‑convolution.
By transforming abstract diffusion‑reaction mathematics into measurable outcomes, educational pilot plants give chemical engineers the intuition to diagnose mass‑transfer problems before they become plant‑scale failures.
Summary Table:
| Experimental Lever | Physical Impact | Key Parameter Demonstrated |
|---|---|---|
| Catalyst Particle Size (L) | Alters diffusion path length and Thiele modulus | Kinetic vs. diffusion-controlled regimes |
| Flow Rate | Minimizes external film mass-transfer resistance | Impact of fluid dynamics on selectivity |
| Temperature | Alters reaction rate relative to diffusion | Apparent activation energy shift |
Equip Your Lab for Hands-On Kinetics Training
Bring textbook chemical engineering concepts to life with LABPARK. We provide advanced Educational and Vocational Unit Operations Pilot Plants in chemical engineering, bioprocess & biotech, and environmental & water treatment.
Specifically designed for universities, research institutes, and enterprises, our pilot plants enable hands-on mastery of:
- Mass transfer resistance and kinetic modeling
- Process optimization and reactor scale-up
- Real-time data acquisition and yield analysis
Empower your students and researchers to diagnose diffusional limitations with real-world equipment. Contact us today to discover our customized pilot plant solutions!
Related Products
- Multi-Reactor Educational Pilot Plant for Reaction Engineering Unit Operations
- Multi-Functional Special Distillation Educational Pilot Plant
- Fixed Bed Gas Solid Catalytic Reaction Educational Pilot Plant
- Carbon Dioxide Hydrogen Methanol Synthesis Educational Unit Operations Pilot Plant
- Fixed-Bed Chemical Reaction and Gas Dust Tar Removal Unit Operations Pilot Plant
People Also Ask
- How do reactor pilot plants define QbD design space? Master chemical process scale-up.
- When configuring a reactor unit operations pilot plant for highly exothermic reactions, how to prevent thermal runaway?
- How do metal ion-catalyzed reaction mechanisms inform chemical engineering pilot plant design? From kinetics to scale-up
- What role do educational pilot plants play in scaling green chemistry? Bridging the Lab-to-Industry Gap
- What are the barriers to process intensification & how do pilot plants help?