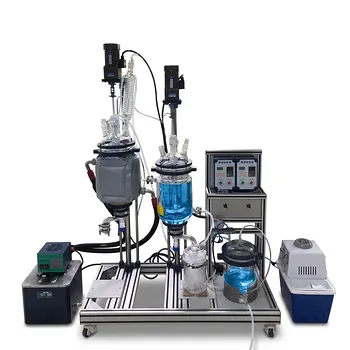
Solubility curves are the decision-makers.
In a chemical engineering pilot plant, you demonstrate the selection of crystallization methods by running side‑by‑side experiments with solutes that have starkly different solubility‑temperature profiles. For a solute like potassium nitrate, whose solubility soars with temperature, cooling crystallization in a jacketed vessel clearly delivers high yield with minimal energy. For sodium chloride, where temperature barely moves the solubility needle, only evaporative crystallization—removing solvent—can generate enough supersaturation. The pilot plant makes this thermodynamic truth tangible, letting students and researchers see exactly why industrial process pathways are chosen based on the solute‑solvent system’s physical chemistry.
The shape of a solubility curve is the non‑negotiable starting point for crystallization method selection. A well‑designed pilot plant turns this abstract principle into a measurable, visual experiment: run the same solute through cooling vs. evaporation, or switch solutes on a modular rig, and the difference in yield, crystal quality, and energy consumption tells the whole story.
The Unignorable Driver: Solubility Curves
The selection of a crystallization method is not a matter of preference—it is dictated by how the solute’s solubility changes with process variables, primarily temperature. A pilot plant is the ideal environment to convert this physical chemistry into an operational lesson.
Why Solubility Curves Hold the Power
Every solute‑solvent system has a unique solubility curve. This curve plots the maximum amount of solute that can dissolve at a given temperature. The shape of that curve—steep, flat, or inverted—determines which thermodynamic lever (cooling, evaporation, solvent composition) can most efficiently create supersaturation.
The Supersaturation Engine
Crystallization requires driving the solution into a metastable zone where the solute concentration exceeds equilibrium solubility. The method that generates this supersaturation with the least energy and the best control is the one that should be selected. A pilot plant demonstrates this by letting you measure the energy input and crystal yield for different methods on the same solute, or the same method on different solutes.
Mapping Solubility Behavior to Crystallization Method
The primary reference makes it simple: if solubility changes a lot with temperature, cool; if it barely changes, evaporate. Real pilot‑plant demonstrations expand that logic into a clear, reproducible workflow.
Cooling Crystallization for Temperature‑Sensitive Solubility
When the solubility curve climbs steeply with temperature, cooling is the most energy‑efficient lever.
A solute such as potassium nitrate dissolves abundantly in hot water (often >100 mg/g) but only sparingly in cold water. By simply lowering the temperature in a jacketed crystallizer, you generate the supersaturation needed for nucleation and growth. In a pilot plant, students observe how precise jacket temperature control translates directly into yield and how cooling rate shapes crystal size distribution.
Evaporative Crystallization for Flat or Inverse Curves
If the solubility curve is nearly horizontal—like that of sodium chloride—or slopes downward (inverse solubility), temperature manipulation alone produces negligible recovery.
The only way to force the solute out of solution is to remove solvent. In the pilot plant, an evaporator vessel (often under vacuum to lower boiling point and save energy) concentrates the solution until supersaturation is reached. The demonstration highlights that while cooling a sodium chloride solution yields almost nothing, evaporating half the water delivers substantial crystal mass.
Extending the Demonstration: Antisolvent and Reactive Methods
Modern pilot‑scale education units frequently go beyond the two‑method comparison to demonstrate the full solvent‑engineering toolkit.
Antisolvent crystallization is shown when a compound has a flat temperature‑response curve and is soluble in one solvent but drops out by more than 50% when a miscible non‑solvent is added—perfect for heat‑sensitive molecules.
Reactive crystallization is introduced for products that are virtually insoluble in all solvents; the pilot plant mixes soluble precursors that rapidly react to form the solid. These extensions teach that when cooling and evaporation hit their thermodynamic limits, the process design must pivot to solvent composition or chemistry.
Designing the Pilot Plant Demonstration
A convincing educational experience hinges on equipment flexibility, proper solute pair selection, and a structured experimental protocol.
Modular and Multi‑Functional Equipment
The pilot plant must physically embody the choices. A configuration that integrates a jacketed stirred tank (for cooling), an evaporator with a condenser and vacuum system, and optional addition lines for antisolvent or reactive feeds lets students reconfigure the flow path based on solubility data. This modular design mirrors the industrial reality that equipment is selected around the material’s properties, not the other way around.
Choosing the Right Solute Pairs
Select solutes with contrasting, well‑documented solubility curves.
The classic pair is potassium nitrate (sharp positive slope) and sodium chloride (flat). For antisolvent demonstrations, use benzoic acid in water with ethanol as the non‑solvent. For reactive crystallization, barium sulfate precipitation from barium chloride and sodium sulfate works well. These choices give predictable, repeatable results that powerfully illustrate the connection between the solubility graph and the unit operation.
Step‑by‑Step Experimental Protocol
- Construct the solubility curve for each candidate solute by measuring saturation concentrations at several temperatures.
- Plot the data and identify the slope. A slope > ~2 mg/g °C suggests cooling crystallization; a slope near zero demands evaporation.
- Configure the pilot plant accordingly. For the cooling path, set up the jacketed crystallizer with temperature control. For the evaporation path, connect the vacuum and heating jacket.
- Charge the solution at the fully dissolved condition and initiate the method. For cooling, ramp the temperature down at a controlled rate. For evaporation, apply vacuum and heat until a predefined solvent mass is removed.
- Measure yield, crystal size distribution, and energy consumption. Compare the two runs directly.
- Discuss why the chosen method succeeded and why the alternative would have failed or been far less efficient.
Understanding the Trade‑offs and Pitfalls
A responsible demonstration must also highlight when a method is not the panacea—and what can go wrong.
The Energy Efficiency Signal
You can directly measure the energy used by the cooling jacket compressor versus the vacuum system and heater. For high‑slope solutes, cooling uses far less energy because it simply removes sensible heat, while evaporative crystallization demands latent heat of vaporization. This side‑by‑side data cements the core lesson that the solubility curve drives the most sustainable process choice.
Avoiding Misleading Yield Comparisons
A common mistake is to run a cooling crystallization on a flat‑curve solute and conclude the method is “bad” because the yield is low—without accounting for the starting conditions. In a pilot plant demonstration, you must normalize for initial concentration and show that the true barrier is thermodynamic, not operational. Only then does the need for evaporation or antisolvent methods become clear.
Polymorph and Solvent Effects
Solvent choice and crystallization method influence not just yield but also the solid form. A pilot plant can demonstrate that a different method (e.g., antisolvent vs. cooling) can select a different conformational polymorph, even starting from the same solute. This introduces the crucial industrial lesson that method selection is also a product‑quality decision, not just a recovery one.
Making the Right Choice for Your Educational Goal
How you configure the demonstration depends entirely on what you want the audience to learn.
- If your primary focus is teaching core thermodynamics: Stick to the classic cooling‑vs.‑evaporation comparison with potassium nitrate and sodium chloride. Measure solubility yourself, plot the curves, and let the yield results speak.
- If your primary focus is industrial process selection: Expand the pilot plant with antisolvent and reactive modules. Use case studies where cooling would be wasteful or impossible, and have students justify the method based solely on the solubility‑temperature diagram.
- If your primary focus is energy and sustainability: Instrument the pilot plant with power meters and calculate the energy per gram of crystal produced for each method. Show that mismatching method to solubility curve can double or triple energy consumption.
- If your primary focus is design‑space exploration: Incorporate solvent composition variation and slow cooling profiles to map the metastable zone width. Let students discover that even within the “correct” method, the operating trajectory must be carefully controlled to avoid oiling out or unwanted polymorphs.
When the pilot plant configuration is truly dictated by the solubility curve, the learning is never abstract—it is a direct, visceral demonstration that the material’s inherent nature writes the rules of the process.
Summary Table:
| Crystallization Method | Solubility Curve Profile | Primary Mechanism | Example Solute |
|---|---|---|---|
| Cooling | Steep positive slope | Temperature reduction in jacketed vessel | Potassium nitrate ($KNO_3$) |
| Evaporation | Flat or inverse slope | Solvent removal (often under vacuum) | Sodium chloride ($NaCl$) |
| Antisolvent | Flat, solvent-dependent | Adding miscible non-solvent to trigger precipitation | Benzoic acid in water/ethanol |
| Reactive | Flat, insoluble product | Mixing precursors to precipitate solid via reaction | Barium sulfate ($BaSO_4$) |
Bring Chemical Engineering Thermodynamics to Life with LABPARK
Are you looking to enhance your teaching or research capabilities? LABPARK provides state-of-the-art Educational and Vocational Unit Operations Pilot Plants in chemical engineering, bioprocess & biotech, and environmental & water treatment.
Specially designed for universities, research institutes, and enterprises, our modular systems help students and engineers visualize complex thermodynamic behaviors like crystallization.
Ready to upgrade your laboratory? Contact LABPARK today to find the perfect pilot plant solution for your needs!
Related Products
- Multi Functional Membrane Crystallization Educational Unit Operations Pilot Plant
- Potassium Salt Thermal Dissolution and Crystallization Separation Educational Unit Operations Pilot Plant
- Multi-Functional Special Distillation Educational Pilot Plant
- Ethyl Acetate Synthesis Unit Operations Pilot Plant for Practical Training
- Multi-Modal Distillation Unit Operations Training Pilot Plant
People Also Ask
- Why is precise temperature control critical in crystallization pilot plants? Key to Scale-Up Success
- Control Crystallization Pilot Plant Secondary Nucleation: 4 Key Adjustments
- How Crystal vs Amorphous Solids Guide Crystallization Pilot Plant Objectives
- What key factors should be considered when configuring a crystallization unit operations pilot plant?
- What are the benefits of integrating online PAT tools like ATR-FTIR into crystallization unit operations pilot plants?