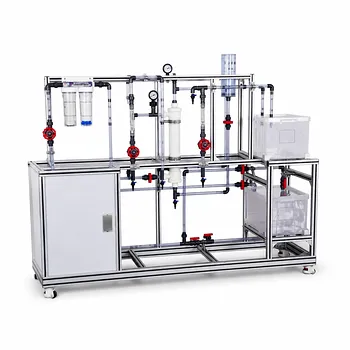
Knowing when to stop washing a filter cake is just as critical as knowing how to start. Instrumentation for filtrate viscosity and washing pressure embed the physics of fluid dynamics directly into a student's hands. Without these real-time measurements, trainees cannot see that a washing liquid's different thickness or altered driving force can silently extend processing time, waste resources, or compromise product purity. By integrating these sensors, training systems transform abstract equations into a tangible, optimizable process.
The core insight: Filtration washing is a fluid displacement step governed by Poiseuille-like flow. When the washing liquid's viscosity or the applied pressure differs from the original filtration, the actual washing time deviates drastically from a simple guess. Live viscosity and pressure data teach students to predict, verify, and correct this deviation—a skill that directly translates to saving water, energy, and batch time in industry.
The Hidden Complexity of Filter Cake Washing
Washing a filter cake looks simple: push a clean liquid through a bed of solids. In reality, it is a race between dilution and displacement, and the outcome dictates product quality and process economics.
Why the Washing Phase Can Make or Break a Product
In biopharmaceutical and fine chemical production, the washing step removes impurities, mother liquor, or spent fermentation broth.
A poorly washed cake means a contaminated high-value product. An over-washed cake wastes enormous volumes of expensive water-for-injection or solvent, while adding processing time.
The Two Variables That Rewrite the Washing Timeline
The washing time is typically designed using the properties of the filtrate and the applied pressure during the initial filtration.
However, the washing liquid almost never has the same viscosity ($\mu$) as the original mother liquor. If the wash is thicker (higher $\mu_w$), it flows more slowly through the cake's pores for the same pressure drop.
Similarly, operators often change the washing pressure ($\Delta p_w$) to protect the cake structure or accelerate the cycle. These changes break the original design basis.
The relationship $\theta_w' = \theta_w (\mu_w / \mu) (\Delta p / \Delta p_w)$ shows that a doubling of viscosity requires a doubled washing time to achieve the same solute removal. A halving of pressure does the same.
Why Real-Time Instrumentation is the Bridge from Theory to Competence
A textbook equation becomes intuitive only when a student can change a variable and watch the system respond. Integrated sensors and data systems turn this into an active learning loop.
Visualizing the Invisible: From Abstract Formula to Live Process Trend
With an in-line viscometer and pressure transducer, students don't just calculate $\theta_w'$ on paper. They run a wash with cold, viscous buffer, observe a real-time drop in effluent flow rate, and correlate it directly with the measured viscosity increase.
This immediate feedback solidifies the relationship between fluid properties and transport phenomena. It builds an instinct for trouble-shooting that memorization cannot.
Teaching Process Optimization, Not Just Operation
Industrial-grade sensors linked to a PLC or SCADA system allow students to design experiments. They can benchmark a standard wash against a temperature-elevated wash that lowers viscosity.
They can then quantify the actual reduction in washing time and water consumption. This hands-on exercise directly teaches the business case for gentle heating of a wash buffer—an optimization that can save millions in a production campaign.
Preparing for the Automated, Data-Rich Industrial Reality
Modern bioprocess facilities are not manual. They rely on continuous monitoring of pressure, flow, and sometimes viscosity to trigger next steps in a batch sequence.
Training on pilot plants with this instrumentation closes the skills gap. Students learn to correlate sensor data with process performance, spot a fouled pressure transmitter that gives a false $\Delta p_w$ reading, and understand the limits of automated correction.
The Broader Bioprocess Lesson: Viscosity is a Master Control Variable
While the primary focus is filtration, teaching the impact of viscosity here unlocks a deeper understanding of its role in upstream processing. This cross-training is a hidden educational goldmine.
Linking Downstream Purity to Upstream Kinetics
Supplementary references highlight that in fermentation, rising broth viscosity directly crushes the oxygen mass transfer coefficient ($k$).
A student who has seen viscosity choke the flow through a filter cake will intuitively grasp why a viscous, high-cell-density culture starves for oxygen. They understand that mixing, mass transfer, and filtration are linked by the same fundamental fluid mechanics.
Instilling a “Holistic Process” Mindset
This connection prevents the dangerous silo mentality that separates upstream biologists from downstream engineers.
The student learns that choosing a strain that secretes a thickening polysaccharide might boost titer but will exact a punishing cost on downstream washing and concentration. The filtration experiment becomes a microcosm for whole-process economic analysis.
Understanding the Trade-offs and Common Pitfalls
Equipping training plants with advanced instrumentation is not without its challenges. Objectively acknowledging these makes the educational case stronger.
The Cost and Maintenance Challenge
Industrial-grade viscosity sensors, especially in-situ types, are expensive and delicate. They require regular calibration and can be damaged by abrasive crystals or steam sterilization.
The pitfall is turning a teaching moment into a maintenance burden. Simple, robust Coriolis meters that also infer viscosity, or paddle viscometers on a bypass loop, can provide 90% of the educational value at a fraction of the complexity.
Avoiding Data Overload
A student staring at multiple real-time trends can miss the underlying physics.
The risk is that they fixate on a pressure spike without connecting it to an air pocket in the wash line. Effective training requires a scaffolded approach: first, understand the $\mu, \Delta p$ correction with manual data, and only then graduate to automated closed-loop control.
Making the Right Choice for Your Training Goal
The level of instrumentation you integrate should directly match the competencies you aim to build. Use these lenses to decide.
- If your primary focus is mastering core purification engineering: Prioritize an easy-to-use in-line viscometer or a temperature-compensated manually drawn sample that feeds a benchtop meter. The goal is repeated, hands-on correlation of the $\theta_w'$ equation with various wash fluids.
- If your primary focus is developing industry-ready automation skills: Integrate full pressure, flow, and viscosity transmitters into a SCADA system. The training value shifts to configuring alarms for high viscosity, trending historical data for batch reports, and tuning PID loops for constant-pressure washing.
- If your primary focus is holistic bioprocess economics: Design multi-day experiments where students not only wash the cake but also measure the viscosity of the fermentation broth that produced it. They can then design a washing protocol that accounts for the upstream viscosity profile.
A pilot plant that makes viscosity and pressure visible does more than teach filtration—it builds the intuition to manage any fluid process with confidence.
Summary Table:
| Parameter | Process Impact | Educational / Training Value |
|---|---|---|
| Filtrate Viscosity ($\mu$) | Dictates flow resistance; higher viscosity slows wash rate and extends cycle time. | Teaches fluid dynamics (Poiseuille flow) and upstream-downstream correlation. |
| Washing Pressure ($\Delta p_w$) | Drives fluid displacement; incorrect pressure risks cake damage or slow washing. | Trains students in process optimization, troubleshooting, and PID loop tuning. |
| Real-time Sensors | Prevents resource waste (water/solvents) and ensures product purity. | Bridges theory and practice; prepares students for automated industrial SCADA environments. |
Elevate Your Engineering Lab with LABPARK
Equip your students and researchers with the practical skills needed for modern industrial processes. LABPARK provides state-of-the-art Educational and Vocational Unit Operations Pilot Plants in chemical engineering, bioprocess & biotech, and environmental & water treatment. Our training systems feature advanced, real-time instrumentation—such as viscosity and pressure sensors—to bridge the gap between textbook theory and industrial reality.
How We Bring Value to You:
- For Universities & Research Institutes: Enhance learning outcomes, increase research accuracy, and prepare students for automated, data-rich industrial careers.
- For Enterprises: Upskill your workforce on scalable, robust pilot plants designed for hands-on operational training.
Ready to transform your laboratory training? Contact LABPARK today to explore our customizable pilot plant solutions!
Related Products
- Hot Filtration Educational Unit Operations Pilot Plant Laboratory System
- Constant Pressure Filtration Educational Unit Operations Pilot Plant
- Multifunctional Membrane Separation Educational Pilot Plant with Ultrafiltration, Nanofiltration, Reverse Osmosis
- Ultrafiltration Membrane Separation Educational Pilot Plant
- Multi-Functional Membrane Separation Educational Pilot Plant for Unit Operations Lab
People Also Ask
- How to Determine Specific Cake (r) & Filter Medium (Rm) Resistance Using Filtration Pilot Plant Data
- How to select solid-liquid separation equipment for pilot plants? A Step-by-Step Guide
- How can researchers identify and resolve filter medium blinding? Optimize Your Pilot Plant Runs
- Why Demo Constant-Rate to Constant-Pressure Filtration on a Pilot Plant? Key Practical Insights
- Why Analyze Filtration Flux & Cake Compressibility in Pilot Plants? Master Solid-Liquid Separation