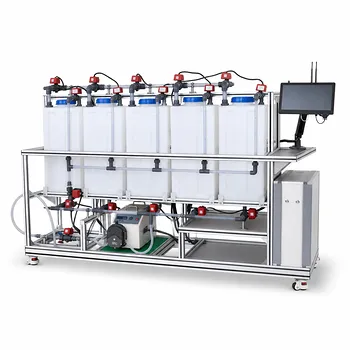
To extract meaningful data from an electrodialysis (ED) pilot plant, you must monitor a carefully chosen set of electrical, hydraulic, and membrane parameters. At a minimum, track the applied DC voltage and current to stay below the limiting current density; the concentrate and dilute stream flow rates to maintain hydraulic balance; and the feed and permeate conductivity to gauge desalination efficiency. Equally important are the membrane and solution resistances, the spacer geometry, and the limiting current density itself—a parameter that defines the safe operating window before water splitting and scaling begin.
Efficient ED operation hinges on understanding and staying within the limiting current density boundary. Monitoring electrical inputs, flow rates, and conductivity provides the real-time data to avoid irreversible membrane damage and to optimize energy use. Deeper analysis of spacer geometry and resistance components reveals the trade‑off between mass transfer and ohmic losses, forming the foundational skill for pilot plant studies.
The Electrical Heartbeat: Voltage, Current, and the Limiting Current Density
Why the Limiting Current Density Is the Non‑Negotiable Parameter
Limiting current density (iₗᵢₘ) is the maximum current you can push before concentration polarization sets in at the membrane surface. If you exceed this threshold, ion depletion becomes so severe that the water itself begins to split into H⁺ and OH⁻ ions. This triggers pH shifts, membrane scaling, and irreversible damage. For students, identifying iₗᵢₘ is the first lesson in safe and efficient ED operation—it marks the exact upper boundary where separation remains clean and energy‑efficient.
How Applied Voltage and Current Reveal the Operating Regime
The DC voltage and current are your real‑time windows into the stack’s behavior. By gradually increasing the applied voltage and recording the resulting current, you can construct a current–voltage curve. The plateau region where current flattens despite rising voltage corresponds to iₗᵢₘ. Staying firmly below this plateau keeps the process under mass‑transfer control and avoids the onset of water dissociation. Continuously logging voltage and current also lets you calculate power consumption and spot fouling early—a sudden rise in voltage for a given current often signals membrane scaling.
The Role of Membrane and Solution Resistance in Voltage Drop
Membrane‑specific resistance (χₘ) and solution‑specific resistance (χ) dictate the ohmic voltage losses across the stack. The total cell voltage is dominated by the IR drop in the diluate compartments, the ion‑exchange membranes, and the concentrate channels. By precisely measuring these resistances—often through electrochemical impedance spectroscopy or simple DC resistance tests—you can disentangle how much energy goes into actual ion separation versus wasted heat. This analysis directly connects to the economic trade‑off between electrical separation energy and the pumping energy needed to circulate fluids.
Hydraulic and Mass Transfer Control: Flow Rates and Spacer Geometry
Balancing Dilute and Concentrate Flows to Prevent Scaling
Maintaining precise flow rates in both the diluate and concentrate streams is essential for hydraulic balance and scaling prevention. If the concentrate flow is too low, salt concentrations at the membrane surface skyrocket, promoting precipitation of sparingly soluble salts like CaSO₄ or CaCO₃. A slight positive pressure on the diluate side also helps prevent cross‑leakage. Students learn that adjusting flow rates is as critical as setting the electrical current—both directly influence the thickness of the diffusion boundary layer that controls mass transfer.
Spacer Factor and Chamber Thickness: Engineering the Diffusion Boundary Layer
The turbulence‑promoting spacer in each flow compartment defines the mass transfer environment. The spacer factor (Kₛ) and the inter‑membrane chamber thickness (d₀) collectively determine the thickness of the diffusion boundary layer (δ). Thinner chambers and optimized spacers increase the limiting current density by reducing δ, meaning you can achieve faster desalination without hitting concentration polarization. Monitoring these geometric parameters teaches the core principle of trade‑offs: a tighter spacer improves mass transfer but increases hydraulic resistance and pumping costs.
Monitoring Feed and Permeate Conductivity to Quantify Separation
Conductivity probes at the inlet and outlet of the dilute stream give a direct, real‑time measure of desalination performance. The difference in conductivity translates into ion removal rates and current efficiency. By comparing the measured salt flux to the theoretical flux based on Faraday’s law, students can quantify current efficiency losses. A sudden drop in efficiency without a change in voltage often points to membrane fouling or internal leakage, making conductivity the single most practical field metric for pilot plant health.
Understanding the Trade‑offs: Energy, Pressure Drop, and Operational Limits
The Pumping vs. Separation Energy Dilemma
Every ED pilot plant sits at the crossroads of two energy consumers: the electrical power for ion migration and the hydraulic power for pumping. Increasing the flow velocity reduces the boundary layer thickness and raises iₗᵢₘ, but it also dramatically increases the pressure drop and pumping energy. The optimum point is where the sum of these two energies is minimized. Training students to vary flow rate while recording voltage and pressure drop turns this abstract trade‑off into a hands‑on optimization exercise.
Spacer‑Induced Mass Transfer Enhancement vs. Hydraulic Resistance
A spacer that creates violent micro‑turbulence can double the limiting current density, but it comes at a steep price in pressure loss. Coarse spacers create lower pressure drop but leave a thicker diffusion layer; fine spacers sharply reduce δ at the expense of higher pumping costs and a higher risk of channel blockage. In a pilot plant, measuring both the pressure differential across the stack and the resulting iₗᵢₘ teaches the pivotal lesson that no membrane or spacer works in isolation—it’s the entire fluid‑dynamic system that counts.
Operating Near the Limit: Why a Safety Margin Matters
Running exactly at iₗᵢₘ is tempting for maximum throughput, but any fluctuation in flow or temperature can push you into the water‑splitting regime. Scaling, pH oscillations, and membrane blistering are the inevitable consequences. A safe rule of thumb is to keep the operating current density at 70–80 % of the measured limiting current density. This margin accounts for local dead zones, spacer shadow effects, and minor fouling, ensuring that the pilot plant runs stably over the full duration of an experiment.
How to Prioritize Your Measurements for Educational Experiments
Depending on the learning objective of your pilot‑plant session, you can emphasize different sets of parameters.
- If your primary focus is teaching the fundamentals of concentration polarization: Start with a current–voltage sweep while holding flow rate constant. Have students record voltage, current, and diluate conductivity at each step to pinpoint iₗᵢₘ and observe the sudden pH drop when the limit is exceeded.
- If your primary focus is energy efficiency analysis: Run the plant at several different current densities and flow velocities, and measure the stack voltage drop, pressure drop, and specific resistances of the membrane and solution. Plot the separation energy, pumping energy, and total specific energy consumption to find the economic optimum.
- If your primary focus is long‑term operational stability: Conduct a multi‑hour run with constant current and continuous monitoring of feed and permeate conductivity, concentrate pH, and differential pressure. Use the trends to detect scaling onset or fouling well before a catastrophic failure.
- If your primary focus is mass transfer fundamentals: Swap spacers of different thicknesses and geometries, and measure the resulting iₗᵢₘ and pressure drop. Relate the observed limits to the spacer factor and chamber thickness, reinforcing the direct connection between geometry and the diffusion boundary layer.
Every measurement you make on an ED pilot plant should serve two purposes: to keep the membrane stack safe and to illuminate a fundamental mass‑transfer or electrochemical principle. By systematically tracking these interconnected parameters, students and researchers transform a simple desalination test into a rich, data‑driven exploration of industrial‑scale separation science.
Summary Table:
| Parameter | Type | Key Operational Role |
|---|---|---|
| Limiting Current Density ($i_{lim}$) | Electrical | Prevents water splitting, pH shifts, and membrane scaling |
| Voltage & Current | Electrical | Tracks stack behavior, power consumption, and early fouling |
| Flow Rates | Hydraulic | Balances dilute/concentrate streams to avoid precipitation |
| Conductivity | Mass Transfer | Monitors inlet/outlet salt removal and current efficiency |
| Spacer Geometry & Thickness | Physical | Controls the diffusion boundary layer and pressure drop |
Elevate Your Engineering Education & Research with LABPARK
For precise experimental control and reliable research data, universities, research institutes, and enterprises trust LABPARK. We design and supply advanced Educational and Vocational Unit Operations Pilot Plants across chemical engineering, bioprocess & biotech, and environmental & water treatment.
Equip your laboratory with systems built for hands-on learning—contact us today to discuss your project requirements!
Related Products
- Electrolytic Hydrogen Production Educational Unit Operations Pilot Plant
- Electrolyte Distillation Purification and Formulation Educational Pilot Plant
- Alkaline Membrane Water Electrolysis Educational Pilot Plant Unit Operations Training System
- Water Electrolysis Hydrogen Production and Storage Educational Pilot Plant
- Electrochemical Water Treatment Educational Unit Operations Pilot Plant
People Also Ask
- In educational chemical engineering pilot plants, why use absorption and adsorption before reforming?
- How do chemical engineering unit operations pilot plants demonstrate catalytic high-purity hydrogen production from methane?
- SMR, POX, or ATR? Trade-offs in Hydrogen Production Educational Pilot Plants
- How do educational unit operations pilot plants address safety and waste management when scaling up?
- How do educational unit operations pilot plants bridge theory and industrial process development? Hands-On Learning