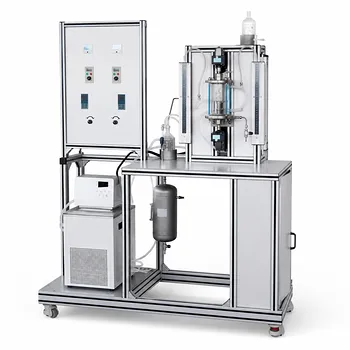
By turning ion separation into a simple race against the clock, a TOF mass analyzer makes a complex analytical technique feel intuitive. In a Time-of-Flight (TOF) mass analyzer, all ions are given the same burst of kinetic energy by an electric field and then released into a field-free drift tube. Because lighter ions travel faster than heavier ones, they arrive at the detector sooner—allowing the instrument to separate ions based on their mass-to-charge ratio ($m/z$). In educational chemistry labs, this principle is demonstrated through a specific mathematical relationship that links flight time, acceleration voltage, and flight tube length, letting students both see and calculate the separation process.
The core insight is that once ions of different mass receive identical kinetic energy, their velocity becomes a direct function of $m/z$. Measuring the flight time over a known distance reveals the mass-to-charge ratio, making the TOF concept exceptionally teachable with simple lab setups and the equation $m/z = (1.928 \times 10^{8}) \cdot V \cdot (\Delta t)^2 / (\Delta x)^2$.
The Physics Behind TOF Separation
Giving Every Ion the Same Kinetic Push
Ions are introduced into the source region and immediately accelerated by a high-voltage electric field. The acceleration voltage ($V$) is applied uniformly, so each ion receives the same potential energy. Because energy is conserved, this potential energy converts entirely into kinetic energy, regardless of the ion's mass. That means a heavy ion and a light ion leave the acceleration zone with exactly the same amount of motion energy—just distributed very differently between mass and speed.
The Drift Region: A Race Against Time
Once accelerated, the ions enter a field-free drift tube—a region with no electric or magnetic fields. Here, they simply coast at the velocity they gained during acceleration. A lighter ion will have a higher velocity because kinetic energy is fixed ($KE = \frac{1}{2}mv^2$). As a result, an ion with a small $m/z$ streaks through the tube and strikes the detector before a heavier one. The arrival time at the detector is called the flight time ($\Delta t$), and it is the sole sorting parameter in a TOF analyzer.
Translating Flight Time into Mass-to-Charge Ratio
The relationship between mass, time, and distance isn’t linear—it’s quadratic. From basic physics, $v = \Delta x / \Delta t$, and $KE = \frac{1}{2}m v^2 = zeV$ (where $ze$ is the ion’s charge). Rearranging yields $m/z = 2eV (\Delta t)^2 / (\Delta x)^2$. In practical educational instrumentation, constants are consolidated into a single factor, giving the direct working equation:
$$m/z = (1.928 \times 10^{8}) \cdot V \cdot \frac{(\Delta t)^2}{(\Delta x)^2}$$
This formula becomes the centerpiece of a classroom demonstration: students measure flight times from a data trace, plug in the known voltage and tube length, and compute the mass-to-charge ratios of sample ions.
Demonstrating TOF in Educational Chemistry Labs
Simplified Instrumentation for the Classroom
Educational TOF mass spectrometers strip away the complexity of research-grade instruments. Typically, they feature a basic ion source (such as electron impact or a simple electrospray), a short accelerator stage, and a clear, visible drift tube. A fast oscilloscope or computer interface records ion arrival times. The entire process is designed to be observed on a benchtop, often with LED indicators or software that highlights the “race” in real time. This hands-on visibility makes an otherwise invisible molecular event tangible.
Visual and Mathematical Learning through the Equation
Students don’t just watch—they actively derive meaning from the data. After a sample is ionized and pulsed into the drift region, the detector signal shows peaks corresponding to different flight times. Using the equation $m/z = (1.928 \times 10^{8}) V (\Delta t)^2 / (\Delta x)^2$, they assign each peak a mass-to-charge ratio. The quadratic dependence is a powerful teaching moment: students see that a small increase in flight time corresponds to a much larger increase in mass, reinforcing why lighter ions finish the race so decisively.
From Data to Understanding: Student Activities
A typical lab exercise involves adjusting the acceleration voltage and observing how flight times shift. For a given ion, raising $V$ shortens the flight time, while lowering $V$ lengthens it—but the relative spacing between different ions remains consistent. Students also explore the effect of flight tube length ($\Delta x$) when different configurations are available. These exercises cement the principle that the $m/z$ measurement relies solely on timing, not on complex magnetic or electric scanning.
Common Pitfalls to Avoid in TOF Demonstrations
Resolution Limitations in Teaching Instruments
Educational mass analyzers often have modest resolution. Slight variations in ion starting position or initial kinetic energy cause arrival-time spread, broadening the peaks. Students may mistakenly attribute poorly resolved peaks to a malfunctioning instrument when in fact it’s an inherent limitation of the simplified design. Contextualizing this in the lab manual prevents misinterpretation.
Sample Preparation and Vacuum Constraints
A TOF analyzer requires a high-vacuum environment so ions don’t collide with gas molecules. In a teaching lab, even minor leaks or poorly sealed samples can ruin the flight path and produce noisy, uninterpretable data. Emphasizing proper vacuum technique and sample cleanliness ensures the demonstration reliably shows the separation principle rather than troubleshooting frustrations.
Interpreting the Equation Correctly
The $K = 1.928 \times 10^8$ factor assumes specific units (eV, seconds, meters) and a single charge state. Students often forget to square the flight time or misplace the decimal. Another common mistake is treating the equation as a direct proportionality between $m/z$ and $t$, missing the quadratic relationship entirely. Explicitly walking through the derivation and having students check unit agreement prevents these errors and reinforces deep understanding.
Making the Right Choice for Your Learning Goal
How you emphasize TOF concepts depends on whether you want to build intuitive understanding, operational competence, or quantitative rigor.
- If your primary focus is grasping the core separation principle: Use the race analogy relentlessly. Compare light and heavy ions to sprinters and marathon runners given the same starting push—timing tells you who’s who.
- If your primary focus is performing accurate mass determinations in the lab: Drill the equation with unit checks and repeated calculations using different voltages. Validate your results against known standards to appreciate the real-world precision and limitations.
- If your primary focus is designing or evaluating educational TOF equipment: Prioritize clear optical windows, simple ion sources, and software that emphasizes flight-time differences. The mathematical link should be front and center, accompanied by experiments that show how voltage and path length alter the timing.
When a TOF analyzer’s elegant race is paired with a clear, hands-on equation, students walk away not just with a mass spectrum, but with a mental model they’ll carry into every future analytical challenge.
Summary Table:
| Parameter | Symbol | Role in TOF Separation | Impact on Flight Time ($\Delta t$) |
|---|---|---|---|
| Mass-to-Charge Ratio | $m/z$ | Determines velocity at a given kinetic energy | Lighter ions ($m/z \downarrow$) arrive faster |
| Acceleration Voltage | $V$ | Dictates the initial kinetic energy boost | Higher voltage ($V \uparrow$) reduces flight time |
| Drift Tube Length | $\Delta x$ | The fixed distance ions travel to the detector | Longer distance ($\Delta x \uparrow$) increases flight time |
Bring Advanced Engineering Principles to Life in Your Lab
Teaching complex analytical and chemical engineering concepts requires robust, hands-on instrumentation. LABPARK provides state-of-the-art Educational and Vocational Unit Operations Pilot Plants in chemical engineering, bioprocess & biotech, and environmental & water treatment designed specifically for universities, research institutes, and enterprises.
Equip your students and researchers with the tools they need to bridge the gap between theory and practical application. Contact us today to discover how LABPARK can elevate your educational curricula and lab capabilities!
Related Products
- Dual-Drive Stirred Gas-Liquid Mass Transfer Coefficient Determination Pilot Plant
- Cavitation Phenomenon Demonstration and Analysis Educational Unit Operations Pilot Plant
People Also Ask
- How does temperature affect mass transfer rates in chemical engineering educational pilot plants?
- How do pilot plants study gas solubility in polymer melts at high pressures? Key Mass Transfer Insights
- How does column packing affect absorption intensification, and how is it evaluated experimentally?
- Why Compare Membrane-Reservoir Models with Pilot Plant Data? Ensure Successful Process Scale-Up
- How does k_La affect hydrogenation scale-up? Critical insights for pilot reactors.