Ionization constants are the essential tools for turning pH neutralization from an erratic guessing game into a precise, calculable process. They allow pilot plant operators to determine the exact amount of acid or base needed to hit a target pH by quantifying the equilibrium behavior of weak acidic or basic species in wastewater. Instead of relying on trial-and-error dosing, you use Ka and Kb to predict the final pH, the buffering effects along the way, and the point where complete neutralization occurs—eliminating chemical waste and ensuring environmental compliance.
The real power of Ka and Kb lies not just in stoichiometric neutralization, but in revealing the entire pH landscape of your wastewater. By accounting for the equilibrium state at every step, you can calculate dosing requirements that achieve your target pH exactly—preventing the costly oscillations and sludge overproduction that plague purely empirical approaches.
The Foundation: How Ka and Kb Define Neutralization Chemistry
The Conjugate Pair Relationship
Every weak acid (HA) and its conjugate base (A⁻) are linked by the ion product of water. The defining equation is Ka × Kb = Kw, where Kw is 1.0 × 10⁻¹⁴ at 25°C. This means that knowing one constant immediately gives you the other. For example, acetic acid’s Ka of 1.75 × 10⁻⁵ yields a Kb for acetate ion of 5.7 × 10⁻¹⁰. This relationship is the bedrock of all dosing calculations.
Why a Weak Acid Doesn’t Just “Neutralize” to pH 7
When you add a strong base like NaOH to acetic acid, the neutralization reaction is technically complete, but the resulting solution is not neutral. The acetate ion formed undergoes hydrolysis, acting as a weak base guided by its Kb. That Kb dictates the hydroxide concentration at the equivalence point, making the final pH slightly alkaline. Ignoring this can lead to a systematic dosing error where you think you’ve hit neutral but actually over- or under-shot your environmental target.
From Constants to Chemical Dose: A Step-by-Step Logic
Determining the Required Base or Acid Mass
First, you use the acid dissociation constant of the wastewater species to find the equilibrium hydrogen ion concentration needed to reach the target pH. Next, you work backward through the neutralization stoichiometry to calculate the moles of titrant required. Because the weak acid or base only partially dissociates, the Ka or Kb tells you how much of the species is available for reaction at any given pH, letting you directly compute the reagent mass per liter of effluent.
The pH Trajectory and Buffering Predicted by Ka
The Ka value also predicts the entire shape of the titration curve. In the buffer region around pH = pKa, pH changes very slowly with added reagent—meaning you need a substantial dose just to move a small pH step. Near the equivalence point, the curve steepens dramatically; very small additions cause large pH spikes. Modeling this with the ionization constants allows your dosing control system to anticipate these zones and avoid overshoot, preventing the oscillatory behavior that wastes chemicals and time.
Advanced Scenarios: Polyprotic Acids and Precipitation Reactions
Stepwise Ionization and Buffer Capacity
Many real wastewaters contain polyprotic acids like phosphoric acid (H₃PO₄). These ionize in steps, each with its own Ka value (K1 >> K2 >> K3). K1 = 7.1 × 10⁻³ for phosphoric acid, while K2 is a mere 6.2 × 10⁻⁸. These constants define multiple buffer plateaus. By plugging the stepwise Ka numbers into your mass balance, you can calculate exactly how much base is needed to cross from one buffer zone to another—essential for accurate dosing in processes where the pH target lies between the pKa values.
Combining Ka with Solubility Equilibria
When your neutralization triggers precipitation, dosing becomes a two‑constant problem. Take the carbonic acid system: you want to raise pH with soda ash (Na₂CO₃) but also precipitate calcium as CaCO₃. You use the second dissociation constant of carbonic acid, K2 = 4.7 × 10⁻¹¹, together with the solubility product of calcium carbonate (Ksp = 1.0 × 10⁻⁸). These constants let you solve for the residual soluble calcium at the target pH. The difference between initial and residual calcium gives the precipitated mass, which directly translates to the required soda ash dose per day, given the pilot plant’s flow rate.
Understanding the Trade-offs and Practical Limitations
Sensitivity Near the Equivalence Point
For weak acid-strong base systems, the equilibrium constant is large (e.g., 1.75 × 10⁹ for acetic acid‑NaOH), meaning the reaction goes to near completion. However, the steep pH change at the equivalence point can throw off simple on‑off control. You must account for this extreme sensitivity in your PID tuning and valve selection; otherwise, even a slight delay in actuator response can create wide pH swings.
Temperature Dependence and Ionic Strength
The relationship Ka × Kb = Kw is only accurate at 25°C. In industrial pilot plants, wastewater temperatures can vary significantly, shifting Kw and thus the calculated Kb. Additionally, high ionic strength from other dissolved salts alters activity coefficients, meaning the concentration‑based constants may not perfectly predict pH. You may need to incorporate temperature correction and activity models for the most demanding treatments.
Measurement Uncertainty in Complex Mixtures
Real effluents rarely contain a single weak acid. Multiple overlapping buffer systems produce a composite titration curve that no single Ka can fully describe. In these cases, dosing calculations based on the dominant species’ Ka still provide a valuable first approximation, but iterative batch titration tests in the pilot plant are essential to refine the model and avoid under‑dosing.
How to Apply This to Your Pilot Plant Project
The approach you choose depends on the complexity of your wastewater and your operational goals. Use the ionization constants as your primary guide, then refine based on real‑time sensor data.
- If your primary focus is simple weak‑acid neutralization: Compute the conjugate base’s Kb from Ka using the Kw relationship, then calculate the equivalence volume and adjust the dose to reach the final pH governed by that Kb.
- If your primary focus is handling polyprotic acids or strong buffering: Map out the entire pH domain using the stepwise Ka values to predict buffer zones and set dosing pump staging accordingly.
- If your primary focus is simultaneous precipitation control: Combine the relevant Ka (e.g., carbonic acid’s K2) with the solubility product to back‑calculate the reagent mass needed to meet both pH and residual metal targets.
- If your primary focus is robust automation and oscillation prevention: Embed the equilibrium model derived from the Ka/Kb into your PID controller’s feed‑forward loop, so the system anticipates steep equivalence regions instead of reacting to them.
Master the ionization constants, and you move from mere pH correction to true chemical process control—saving reagents, protecting downstream biology, and making your pilot plant a reliable blueprint for full‑scale success.
Summary Table:
| Scenario | Chemical Dosing Impact | Practical Solution |
|---|---|---|
| Weak Acid/Base Hydrolysis | Equivalence point pH is not neutral (pH ≠ 7). | Calculate Kb from Ka to predict actual endpoint pH. |
| Buffer Regions (pH ≈ pKa) | High chemical demand with minimal pH change. | Set dosing pump staging to handle buffer capacity. |
| Polyprotic Acids | Multiple buffer plateaus occur in steps. | Model stepwise Ka values for multi-stage neutralization. |
| Precipitation Reactions | Dosing affects both pH and metal precipitation. | Combine Ka with solubility product (Ksp) calculations. |
Scale Up Your Water Treatment Research with LABPARK
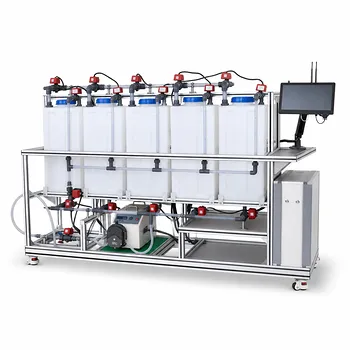
Precision in pH neutralization is critical for successful pilot plant operations. LABPARK provides premium Educational and Vocational Unit Operations Pilot Plants in chemical engineering, bioprocess & biotech, and environmental & water treatment.
Designed specifically for universities, research institutes, and enterprises, our systems allow you to accurately model chemical equilibria, optimize dosing algorithms, and provide hands-on training for real-world environmental challenges.
Ready to elevate your research and training capabilities? Contact us today to explore our custom pilot plant solutions!
Related Products
- Electrochemical Water Treatment Educational Unit Operations Pilot Plant
- Thermal Desorption Exhaust Gas and Tail Water Treatment Educational Pilot Plant
- Ion Exchange Water Purification Educational Pilot Plant for Engineering Unit Operations
- Water Electrolysis Hydrogen Production and Storage Educational Pilot Plant
- Continuous Batch Extractive Distillation Educational Pilot Plant
People Also Ask
- What design features do educational electrochemical pilot plants utilize to manage gas liberation and water loss?
- How can unit operations pilot plants show lead-acid concentration vs state of charge? Real-time monitoring guide.
- How do educational electrochemical pilot plants scale up electrolysis? Master industrial engineering.
- How to Estimate Sulfate in Water Treatment Pilot Plant Deposits: Gravimetric Guide
- How can foaming be managed during steam generation experiments in water treatment unit operations pilot plants? Tips