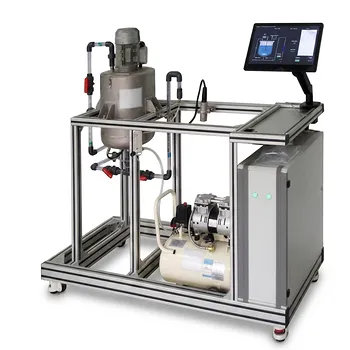
Measuring interfacial tension (IFT) is the only direct way to confirm if you’ve achieved miscible displacement—the holy grail of gas injection for maximizing oil recovery. When IFT between the injected gas and the reservoir oil drops to near-zero values, the two phases become effectively one, eliminating capillary trapping and allowing you to sweep out nearly all the remaining oil. But to design a process that reliably hits that condition, you must also master the underlying phase behavior: how the gas and oil interact at reservoir temperature and pressure, how their compositions change during mass transfer, and where the critical point—where IFT truly vanishes—actually lies.
The criticality of IFT and phase behavior in gas injection is twofold: low IFT signals the onset of miscibility and high displacement efficiency, while comprehensive phase behavior maps tell you exactly what injection pressure and gas composition will get you there. In unit operations pilot plants, these principles are taught not through abstract equations but by physically reproducing reservoir conditions in high-pressure cells, constructing real pressure-composition diagrams, and visually observing the vanishing interface—turning thermodynamic theory into an intuitive, unforgettable lesson for future engineers.
Why IFT and Phase Behavior Are Non-Negotiable in Gas Injection
IFT as the Direct Indicator of Displacement Efficiency
In any gas injection process—whether CO₂ flooding, enriched gas drive, or even dry gas injection—the ultimate target is to reduce residual oil saturation below what waterflooding alone can achieve. The mechanism that makes this possible is the reduction of capillary forces, and IFT is the metric that quantifies that reduction. Capillary number, which governs microscopic displacement, is inversely proportional to IFT. So when IFT plunges from typical oil-water values (20–30 mN/m) down to (10^{-3}) mN/m or less, the capillary forces that trap oil in small pores essentially disappear.
The primary reference emphasizes that achieving “near-zero IFT” is the hallmark of miscible displacement. Without this measurement, you’re flying blind—guessing whether your injection pressure is high enough or your gas composition rich enough to truly mix with the oil. A process that looks miscible on paper may still operate in a near-miscible regime with a small but persistent IFT, leaving substantial oil behind.
Phase Behavior: The Map That Guides You to Zero IFT
IFT does not exist in isolation; it is a consequence of the phase equilibrium between the injected gas and the reservoir oil. You cannot interpret an IFT number without understanding the phase envelope it belongs to. The supplementary references highlight that phase equilibria pilot units let you construct pressure-composition diagrams that reveal the bubble point curve, dew point curve, and, crucially, the critical point. At that critical point, the properties of the two phases converge: density difference tends to zero, composition difference disappears, and IFT becomes exactly zero.
For a given oil, the minimum miscibility pressure (MMP) is essentially the pressure at which the injection gas develops a critical tie line with the oil. In the lab, as you approach that point, you see not only IFT dropping but also K-values (the distribution coefficients of components between phases) approaching 1.0. This signals that the oil is vaporizing into the gas phase and the gas is condensing into the oil to such an extent that the distinction fades. Without these phase behavior measurements, you cannot reliably determine MMP, define the optimal injection pressure, or predict the compositional path the system will take during multi-contact miscibility.
Mass Transfer Dynamics Change Everything
Reservoir displacement is not a single equilibrium stage; it is a dynamic process where the gas phase continuously contacts fresh oil. The primary reference notes that pilot plants can track how the gas phase becomes enriched with heavier components (like C2+ fractions) as it advances. This forward enrichment or backward condensation is the engine of miscibility development in many gas injection processes.
In a vaporizing gas drive, for instance, intermediate components from the oil partition into the advancing gas front until the front’s composition reaches the critical point with fresh oil. Measuring the evolving IFT along the flow path in a porous medium shows you whether that mechanism is actually happening or if mass transfer limitations are preventing the gas composition from ever reaching the required enrichment. That real-time insight is exactly what a static pressure-composition diagram cannot provide—and why pilot-scale dynamic measurements are indispensable.
How Unit Operations Pilot Plants Bring These Concepts to Life
High-Pressure Visual Cells for IFT Observation
The core teaching tool is a high-pressure, temperature-controlled cell with a transparent sapphire window. Inside, a known quantity of reservoir oil is contacted with the injection gas at a set pressure and temperature. The most powerful learning moment happens when students watch the oil-gas interface physically flatten, distort, and then vanish as the pressure is slowly raised toward the MMP. The primary reference underscores that this visual disappearance of the meniscus is the empirical proof that IFT has reached near-zero values.
These setups are often coupled with pendant-drop or capillary-rise techniques to quantify IFT values down to extremely low levels. The pilot plant becomes a direct analogy to what happens in the reservoir—except the student can see it, control it, and measure the response in real time. It bridges the chasm between a textbook equation for IFT and the tangible reality of phase miscibility.
Constructing Pressure-Composition Diagrams
Phase equilibria pilot units take this a step further by systematically varying the overall composition and pressure of a synthetic solvent-oil mixture. As the supplementary references explain, students can generate the entire phase envelope, pinpointing the bubble point, dew point, and critical point. At the critical point, they observe not only the disappearance of the interface but also the convergence of liquid and vapor densities and the approach of K-values to unity.
This hands-on diagram construction teaches a deep lesson: the same equipment that measures IFT is used to define the very space in which that IFT lives. Students learn that there is no mystery to miscibility—it is the logical consequence of a thermodynamic path that ends at the critical composition and pressure. And because they built the diagram themselves, they internalize how injection pressure and gas composition shift that path, directly connecting the phase behavior maps to practical design decisions.
Integrating Mass Transfer and Flow Through Porous Media
The primary reference mentions that pilot plants can track IFT changes over time and distance as the gas phase moves through a porous medium. By packing a section of the high-pressure cell with sand or a core sample, the pilot plant transitions from a static equilibrium cell into a dynamic flow experiment. Students can inject gas and measure the composition of the effluent gas at different points, watching it become richer in intermediate hydrocarbons as it travels.
This setup reveals the mass transfer effects that are the beating heart of miscible gas injection. Students see that the MMP measured in a static cell may not be sufficient if the velocity is too high for mass transfer to complete, or if dispersion dilutes the enriched front. The pilot plant thus teaches a critical caution: equilibrium-derived MMP is a necessary but not sufficient condition—the process must also provide adequate residence time and interfacial area for the phase behavior to actually do its work.
Understanding the Trade-offs and Limitations
Pilot Plants Are Simplified Idealizations
The controlled conditions of a pilot plant—constant temperature, homogeneous sand pack, pure gases—are intentionally simple. In a real reservoir, heterogeneity, viscous fingering, gravity override, and complex oil compositions introduce deviations that no pilot plant can fully replicate. Teaching with pilot plants is invaluable, but must be accompanied by a discussion of these scaling realities. The measured MMP remains valid, but the actual recovery efficiency will be lower due to sweep inefficiencies that the pilot plant deliberately excludes.
Static vs. Dynamic Measurements Can Diverge
A key educational trade-off is between static cell IFT measurements and dynamic flow displacements. The supplementary references emphasize the importance of specific interfacial area and mass transfer resistance, concepts also central to absorption and extraction unit operations. In a gas injection context, the effective IFT controlling residual oil saturation may differ from the equilibrium IFT measured in a static cell because dynamic concentration gradients persist near the interface. Pilot plants that force students to compare static and dynamic data hammer home the point that phase equilibrium is a destination—but the path there depends on kinetics and transport.
Generalization Across Fluid Systems
The phase behavior and IFT trends observed with a specific live oil and CO₂ mixture in the pilot plant will not translate exactly to another crude. The lesson is in the method, not the specific numbers. By running multiple fluid systems, students learn how to adapt the experimental protocol and how to interpret pressure-composition diagrams for any gas-oil pair. The pilot plant thus teaches experimental design and thermodynamic reasoning rather than just memorization of one particular result.
Making Theory Work in Practice
If your primary focus is designing a gas injection project: Start with a phase behavior study in a high-pressure pilot cell. Build the full pressure-composition diagram to determine the MMP and the required injection gas composition. Let IFT measurements confirm the approach to miscibility as you approach that point.
If your primary focus is educating engineers on the mechanism of miscible displacement: Use pilot plants to make the invisible visible. Have them watch the interface vanish, measure the IFT drop, and correlate it with the K-value convergence. Let them then run a dynamic flow test to see how mass transfer enrichment drives the system toward that critical state, reinforcing that phase behavior is a journey, not just a final equilibrium.
If your primary focus is bridging simulation and reality: Use the pilot plant data to tune your equation-of-state models. The measured phase envelope, critical point, and IFT curve provide calibration targets that turn a generic thermodynamic model into a predictive tool for the specific oil and gas you’re dealing with.
Ultimately, IFT and phase behavior are not just academic curiosities—they are the direct language of miscibility. Unit operations pilot plants translate that language from complex thermodynamic texts into a tangible, visual, and measured experience, producing engineers who can design, troubleshoot, and optimize gas injection processes with genuine insight rather than blind reliance on software defaults.
Summary Table:
| Key Concept | Role in Gas Injection (EOR) | How Pilot Plants Teach It |
|---|---|---|
| Interfacial Tension (IFT) | Direct indicator of miscible displacement; near-zero IFT eliminates capillary trapping. | Visualizing meniscus disappearance in high-pressure sapphire cells; measuring via pendant-drop. |
| Phase Behavior | Provides the thermodynamic map (P-X diagrams) to locate critical points and determine MMP. | Constructing pressure-composition diagrams and observing phase convergence systematically. |
| Mass Transfer | Drives dynamic miscibility through forward enrichment or backward condensation. | Running flow tests through sand-packed/core media and analyzing effluent composition over time. |
Bring Thermodynamic Theory to Life with LABPARK
At LABPARK, we help universities, research institutes, and enterprises bridge the gap between abstract equations and real-world industrial application.
Our high-fidelity Educational and Vocational Unit Operations Pilot Plants in chemical engineering, bioprocess & biotech, and environmental & water treatment allow students and researchers to hands-on observe, measure, and analyze complex processes like interfacial tension and phase behavior.
Ready to elevate your laboratory's training capabilities and research outcomes? Contact us today to explore our custom pilot plant solutions!
Related Products
- Bernoulli Equation Demonstration Unit Operations Pilot Plant
- Educational Unit Operations Pilot Plant for Intraparticle Diffusion Effective Factor Measurement
- Agitation and Mixing Educational Unit Operations Pilot Plant
- Carbon Dioxide PVT Curve Determination Educational Unit Operations Pilot Plant
- Shell and Tube Heat Exchanger Heat Transfer Coefficient Determination Educational Pilot Plant
People Also Ask
- How does nozzle geometry affect energy efficiency and jet performance in fluid mechanics laboratory demonstration units?
- How is the Bernoulli equation applied in fluid mechanics training plants? Visualize energy conservation rules.
- How to demonstrate rapid vs slow valve closure? Clear water hammer transient experiments for engineering labs.
- Why does the liquid surface form a parabolic profile? Modeling forced-vortex behavior in process equipment
- How can fluid mechanics unit operation training units visually demonstrate flow? See laminar-to-turbulent transition in action