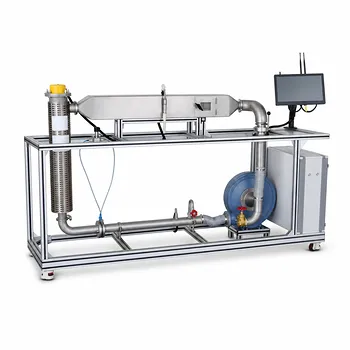
Visualizing the process is vastly superior to crunching numbers. In a chemical engineering unit operations pilot plant focused on drying, the Enthalpy-Humidity (H-I) chart is preferred over manual calculations because it instantly transforms live sensor data into a complete thermodynamic map of the air. This graphical method bypasses the need for tedious, iterative trial-and-error equations, enabling real-time process monitoring and immediate decision-making during an experiment.
Manual psychrometric calculations for parameters like adiabatic saturation temperature are slow and iterative. The H-I chart fundamentally solves this by providing an instantaneous, visual shortcut: measure any two independent air properties from your pilot plant sensors, and you can directly read all other defining parameters on a single diagram, eliminating computational delay and error.
Beyond the Math: The Deep Need for Speed and Insight
The explicit question asks about preference, but the underlying need is for operational control and deep process understanding. A pilot plant is a high-speed learning environment, not a theoretical exercise. The H-I chart meets this need by converting abstract sensor readings into an intuitive visual language.
Cutting the Computational Chain
Manual calculation of psychrometric properties is notoriously recursive. Finding the wet-bulb temperature, for instance, requires guessing a temperature, calculating heat and mass transfer, and iterating until your heat balances agree.
The H-I chart eliminates this bottleneck in one step. By plotting the intersection of known values from your sensors—such as the dry-bulb temperature line and the wet-bulb temperature line (approximated by an adiabatic saturation line)—you fix the air’s state point instantly. No iterations are required.
From Two Data Points to Complete Definition
Sensors on a drying pilot plant typically provide two key data streams: often dry-bulb temperature ($t$) and wet-bulb temperature ($t_w$), or dry-bulb temperature ($t$) and relative humidity ($\varphi$).
Once the state point is locked in with just these two inputs, the chart yields all remaining parameters at a glance. Operators can immediately determine moisture content ($H$), enthalpy ($I$), dew point ($t_d$), and water vapor partial pressure ($p_v$). This provides a complete thermodynamic profile in seconds, which is essential for dynamic unit operations experiments.
A Visual Blueprint for the Drying Process
The true power of the H-I chart in a pilot plant lies in its ability to visualize the entire drying trajectory, helping operators and students see the "why" behind changing process conditions.
Mapping the Air’s Journey Through the Plant
In a convective drying pilot plant, air acts as both the heat carrier and the moisture carrier. The chart allows you to map this journey. A horizontal line to the right shows the preheating stage (constant moisture, increasing temperature and enthalpy). A line following an adiabatic saturation path shows the air’s state change as it picks up moisture in the drying chamber.
This visual trace helps students and researchers instantly connect theoretical principles with the physical changes happening inside the equipment. It visually answers the question: how much heat was added in the preheater, and how much moisture was absorbed in the dryer?
A Critical Warning System Against Condensation
This visual insight is not just educational; it's an operational safeguard. The chart makes the dew point an easily readable, non-negotiable boundary.
If the process air temperature anywhere in the system drops below this visible dew point line, condensation will occur. In a pilot plant, this can ruin a delicate product, cause inaccurate moisture readings, or even lead to clogging. The H-I chart constantly provides this critical visual check, allowing operators to maintain the necessary degree of superheat and prevent failed experimental runs.
Understanding the Trade-offs of the Graphical Method
While the H-I chart is a powerful tool for real-time use, building trust requires acknowledging its limitations. It is not a universal, perfectly precise solution.
Pressure Dependency and Accuracy
The primary constraint is that a standard H-I chart is constructed for a single atmospheric pressure, commonly $1.013 \times 10^5$ Pa. If your pilot plant operates at significantly different pressures, a standard chart will introduce errors.
Furthermore, reading values from a printed chart involves interpretive interpolation, which is inherently less precise than a computational digital twin. However, for the purpose of process monitoring, control decisions, and student comprehension in a pilot plant, this speed-to-insight ratio almost always outweighs the need for 5-decimal-place precision.
Over-Simplifying Complex Scenarios
The chart’s clarity can also be a limitation when dealing with non-ideal mixtures or extreme conditions where the standard psychrometric relationships begin to break down. For deep analytical work, such as precisely calculating energy efficiency after optimizing exhaust parameters, operators will ultimately feed chart-derived values into energy and mass balance equations. The chart is the navigator, not the final calculation engine.
Making the Right Choice for Your Goal
Your choice between the H-I chart and a digital calculator should depend on your immediate objective in the pilot plant.
- If your primary focus is real-time process control and situational awareness: The H-I chart is non-negotiable. It instantly translates two sensor readings into a complete visual state, allowing you to spot trends and avoid condensation risks without computational lag.
- If your primary focus is post-experiment data analysis or high-precision reporting: A validated digital psychrometric calculator or software is the superior tool. It will provide the numerical precision needed for detailed heat and mass balance calculations and efficiency analysis from logged data.
The H-I chart is not merely a shortcut for avoiding math; it is a visual thinking tool that builds an intuitive, gut-level understanding of the psychrometric process that no spreadsheet can provide.
Summary Table:
| Feature | H-I Chart (Graphical Method) | Manual Calculations |
|---|---|---|
| Speed of Analysis | Instant, real-time mapping | Slow, iterative trials |
| Parameters Determined | Multi-parameter read from 2 inputs | Calculated individually |
| Process Visualization | Clear, visual trajectory & dew point | Abstract numerical values |
| Precision | Interpretive approximation | High numerical precision |
| Primary Use Case | Real-time monitoring & training | Post-experiment data analysis |
Enhance Your Engineering Lab with LABPARK
Take your teaching and research to the next level. LABPARK designs and manufactures premium Educational and Vocational Unit Operations Pilot Plants in chemical engineering, bioprocess & biotech, and environmental & water treatment for universities, research institutes, and enterprises.
Our pilot plant systems are engineered to help students and researchers visualize complex thermodynamic changes in real-time, bridging the gap between theory and physical practice.
Ready to upgrade your lab's capabilities? Contact LABPARK today to request a catalog or discuss your custom laboratory requirements!
Related Products
- Multi-Functional Drying Educational Unit Operations Pilot Plant
- Circulating Wind Tunnel Drying and Convective Heat Transfer Coefficient Determination Educational Pilot Plant
- Natural Product Extraction Unit Operations Training Pilot Plant
- Electrolyte Distillation Purification and Formulation Educational Pilot Plant
- Polymerization Granulation and Pellet Processing Educational Unit Operations Pilot Plant
People Also Ask
- Vacuum vs. Atmospheric Drying: How to Choose the Right Pilot Plant Configuration for Your Lab
- How do seasonal changes affect drying pilot plant blower requirements? Key sizing tips.
- Why is dry-basis moisture content preferred over wet-basis? Simplify your drying pilot plant balances.
- Why Does a Pilot Plant Solver Return a Singular Matrix Error, and How Can You Resolve It?
- How do deviations in estimating latent heat impact pilot plant thermal systems? Avoid hardware mis-sizing.