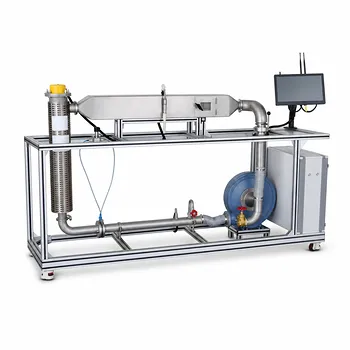
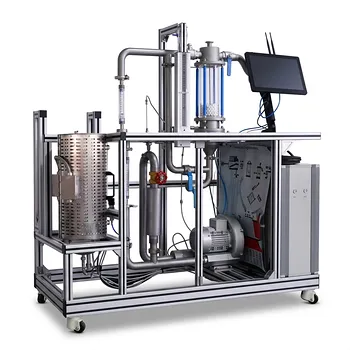
The three steps—convection from the hot fluid to the wall, conduction through the solid wall, and convection from the wall to the cold fluid—are demonstrated by physically isolating the thermal resistances in a pilot-scale recuperative heat exchanger. Instructors achieve this by instrumenting the unit to measure the inlet and outlet temperatures of both fluid streams, their flow rates, and frequently the temperature of the tube wall itself. Using these values, students can calculate the individual convective heat transfer coefficients, verify the conductive resistance of the wall material, and solve the overall heat transfer rate equation, thereby quantifying how each step influences total system efficiency.
The pilot plant transforms a theoretical series of resistances into a tangible, measurable system. By strategically placing sensors and teaching students to calculate parameters like the Nusselt, Reynolds, and Prandtl numbers, instructors directly link the abstract "three steps" to the hard data of temperature gradients, flow conditions, and material properties.
Deconstructing the Three Sequential Steps
A wall-type heat exchanger is an elegant system for teaching thermal resistance because its geometry forces heat to pass through three distinct physical phenomena in a precise order. The pilot plant is designed to decouple these phenomena mathematically.
Step 1: Convective Transfer from Hot Fluid to Wall
The process begins with forced convection. The hot bulk fluid carries a significant store of thermal energy, but a stagnant boundary layer clings to the inner solid wall, acting as the primary initial resistance. Instructors demonstrate this by varying the flow rate of the hot fluid. Students observe that at higher velocities, the increased turbulence thins the boundary layer, dramatically improving the heat transfer coefficient (h_i). This is quantified by calculating the Nusselt number (Nu), which for forced convection in tubes is a function of the Reynolds number (Re) and Prandtl number (Pr).
Step 2: Conductive Transfer Through the Metal Wall
Resistance within the solid wall itself is governed by Fourier’s Law of conduction. This is the most straightforward step to isolate, as it depends on fixed physical properties: the wall’s thickness and the material’s thermal conductivity (k). An instructor will contrast a standard stainless steel tube with a hypothetical material of higher k. Students learn that while metal conductivity is rarely the rate-limiting step, it is a finite and calculable resistance that contributes to the total temperature drop between the two fluid streams.
Step 3: Convective Transfer from Wall to Cold Fluid
The final step is a mirror of the first: heat must move from the outer wall surface through another laminar boundary layer into the cold fluid bulk. The pilot plant reveals that this side of the heat exchanger often governs the overall sizing, especially if the cold fluid is viscous or has a low thermal conductivity. Instructors highlight process asymmetries—for instance, a highly turbulent hot water stream on one side heating a sluggish oil on the other—to show how the highest resistance on the cold side dictates the overall heat load.
How the Pilot Plant Makes the Invisible Visible
The true pedagogical power of the pilot plant lies not in the steps themselves, but in the instrumentation that converts thermal theory into a quantitative exercise. The system is a "data generation engine."
The Strategic Placement of Sensors
The minimum instrumentation involves four thermocouples (fluid inlets and outlets for both hot and cold sides) and two flow meters. To go deeper, instructors use plants with embedded wall thermocouples that measure the metal temperature at various points along the tube. This direct measurement allows students to bypass guesswork on the fluid-to-wall temperature drop. They can also place pressure transducers across the exchanger, enabling the calculation of friction factors and pump energy costs, which are critical trade-offs against enhanced heat transfer.
Turning Data into Coefficients
The primary parameter students calculate is the overall heat transfer coefficient (U) using the measured heat duty and the log mean temperature difference (LMTD). A key practical lesson is the selection of the qualitative temperature for fluid property tables. For low-viscosity fluids, the arithmetic mean of the inlet and outlet is sufficient. However, an instructor will demonstrate that for high-viscosity fluids, a correction using the Sieder-Tate equation, which requires evaluating the wall viscosity at the measured wall temperature, is essential to align empirical correlations with experimental reality.
Understanding the Trade-offs and Practical Realities
A purely theoretical analysis falsely suggests a perfectly clean, predictable system. The pilot plant makes the non-idealities impossible to ignore, which is the most valuable lesson for process engineering.
The Sensitivity to Temperature Measurement
Accurate temperature measurement is the greatest experimental challenge. A thermocouple calibration error of just 1°C on a small pilot unit can lead to a 10-20% error in the calculated LMTD, and thus a large error in the derived U value. This teaches students why industrial designs use large safety factors and why computational models need experimental validation. The pilot plant data forces them to critically analyze the quality of their raw inputs.
The 'Clean' vs. 'Fouled' State
The plant rigorously demonstrates fouling resistance. After a known period of operation with untreated water or a fouling-prone process fluid, students can repeat the experiment. The measured U coefficient will drop substantially. By knowing the theoretical conductive resistance of the clean tube and the two convective coefficients, they can back-calculate the fouling factor (R_f). This directly proves that this seemingly abstract resistance on the data sheet represents a tangible, costly insulating scale layer on the wall.
Making the Right Choice for Your Experiment
Your specific experimental goal dictates how you configure and analyze the pilot plant’s recuperative heat exchanger.
- If your primary focus is validating theoretical correlations: Insist on wall temperature measurements and precise flowmeters. Use the data to isolate the convective coefficient on one side by keeping the other side’s resistance constant, plotting Nusselt vs. Reynolds numbers to verify the Dittus-Boelter correlation.
- If your primary focus is proving the impact of fouling: Establish a precise baseline overall heat transfer coefficient (U) with pristine fluids first, then introduce a controlled contaminant. The quantitative drop in U is the definitive measure of fouling resistance, driving home the need for chemical cleaning protocols.
- If your primary focus is optimizing energy efficiency: Run the exchanger in both co-current and counter-current configurations. The measured LMTD in counter-current flow will always be lower for the same outlet targets, yet it achieves a far more efficient heat recovery, powerfully demonstrating a fundamental design choice.
The pilot plant ultimately connects the abstract mathematics of heat transfer to the physical reality of metal, fluid, and scale, transforming students from theoretical learners into practical process analysts.
Summary Table:
| Heat Transfer Step | Phenomenon | Key Parameters Measured / Calculated | Educational Focus |
|---|---|---|---|
| 1. Hot Fluid to Wall | Forced Convection | Inlet/outlet temperatures, flow rates, Reynolds (Re), Nusselt (Nu) | Thinning boundary layer via flow rate variation |
| 2. Through the Wall | Conduction | Wall temperatures, wall thickness, thermal conductivity (k) | Fourier’s Law and material resistance |
| 3. Wall to Cold Fluid | Forced Convection | Inlet/outlet temperatures, overall heat transfer coefficient (U), LMTD | Overall heat load limiters, Sieder-Tate corrections, fouling factor (Rf) |
Bring Heat Transfer Theory to Life in Your Lab
Looking to enhance your engineering curriculum or research capabilities? LABPARK provides state-of-the-art Educational and Vocational Unit Operations Pilot Plants in chemical engineering, bioprocess & biotech, and environmental & water treatment for universities, research institutes, and enterprises.
Our pilot-scale heat exchangers and unit operations systems empower you to:
- Enhance Learning: Bridge the gap between thermodynamic theory and physical reality with hands-on experimentations.
- Ensure Precision: Equip students and researchers with industry-grade instrumentation to measure flow rates, LMTD, and fouling factors.
- Optimize Research: Generate reliable, publishable data with robust equipment built to industrial standards.
Ready to upgrade your laboratory setup? Contact LABPARK today to discuss your custom pilot plant requirements!
Related Products
- Shell and Tube Heat Exchanger Heat Transfer Coefficient Determination Educational Pilot Plant
- Comprehensive Multi-Modal Heat Transfer Unit Operations Pilot Plant for Engineering Training
- Three-Tube Heat Transfer Educational Pilot Plant for Unit Operations Training
- Dual Mode Heat Transfer Pilot Plant for Unit Operations Training
- Comprehensive Heat Transfer Coefficient Determination Educational Unit Operations Pilot Plant
People Also Ask
- Why Apply LMTD Correction in Shell-and-Tube Pilot Plants & How to Determine It
- How to Estimate Shell-Side Pressure Drop in a Shell-and-Tube Heat Exchanger Pilot Plant: Key Parameters Explained
- Why adjust baffle spacing in shell-and-tube heat exchanger pilot plants? Master heat transfer & pressure drop.
- How is the fouling factor (Rd) evaluated? Key Pilot Plant Insights for Students
- How is fouling factor demonstrated using shell and tube pilot plants? Practical Lab Guide