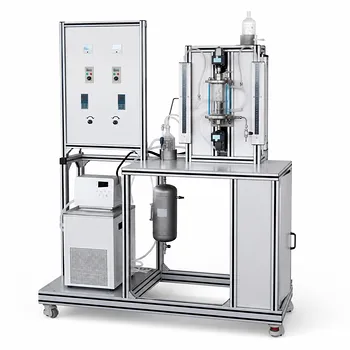
The answer lies in the fundamental shift in two-phase flow dynamics. When a microchannel gas-liquid separator transitions to a slug flow regime, the alternating slugs of gas and liquid overwhelm the capillary separation mechanism, causing a sharp increase in liquid carryover to the gas outlet. This liquid breakthrough is driven by a specific pressure-dependent shift in superficial velocities, and unit operations laboratories study it using quantitative flow maps and dimensionless analysis to define the safe operating window for these compact separators.
The transition to slug flow is a primary failure mode for microchannel separators. It occurs when rising system pressure reduces gas velocity without changing liquid velocity, pushing the flow into a regime where large liquid slugs cannot be easily separated. Labs use the Bousman flow map and Suratman number to predict and visualize this transition, directly linking fluid properties and channel geometry to the risk of liquid breakthrough.
Why Slug Flow Causes Liquid Breakthrough
Microchannel separators rely on surface tension and wettability to passively split liquid and gas phases. This delicate balance fails dramatically in slug flow.
The Capillary Separation Mechanism
In microchannels, liquid tends to flow along the channel corners or walls as a thin film, while gas occupies the core. A properly designed separator uses a downstream branch or hydrophobic membrane that selectively wicks away the liquid phase based on capillary pressure and geometric wetting barriers. This separation is highly efficient only when the liquid is continuously and controllably connected to the removal port.
How Slug Flow Overpowers These Mechanisms
Slug flow introduces large, regularly spaced liquid slugs that bridge the entire channel cross-section. These slugs travel with high momentum and push gas pockets ahead of them. When a liquid slug reaches the gas outlet branch, it overcomes the capillary barrier and breaks through, contaminating the gas stream. The separation becomes chaotic because the liquid phase is no longer a steady, wickable stream but an intermittent plug that forces its way into the wrong exit.
The Role of Pressure-Induced Superficial Velocity Shifts
As system pressure increases, gas density rises, and the volumetric flow rate (and thus superficial velocity) of the gas phase decreases. The liquid superficial velocity, being nearly incompressible, remains relatively constant. This mismatch shifts the operating point on the flow regime map from favorable regimes like annular or bubbly flow directly into slug flow, even if the mass flow rates are unchanged. The resulting change in phase distribution is what triggers the liquid breakthrough.
How Unit Operations Labs Study This Transition
In educational and research pilot plants, studying this behavior is a core exercise in process intensification and multiphase flow fundamentals.
Using Flow Maps for Real-Time Prediction
The most common tool is the Bousman flow map. This experimentally validated map plots the liquid and gas superficial velocities against observed two-phase flow regimes (bubbly, slug, annular, etc.) for a given channel geometry and fluid pair. Students or researchers set initial flow rates, then systematically increase system backpressure. They observe the separator’s outlet purity and record the superficial velocity coordinates at the exact moment liquid breakthrough begins. Overlaying these points on the Bousman map visually confirms that failure consistently occurs as the operating point crosses into the slug region.
The Suratman Number as a Design and Scaling Tool
While flow maps are excellent for a specific channel, scaling insights demand dimensionless numbers. The Suratman number—a ratio of capillary forces to viscous forces—directly measures a microchannel’s ability to resist slug formation. Labs use the Suratman number to compare different channel dimensions and fluid properties. A higher Suratman number typically indicates a wider window of stable, non-slug operation, as surface tension dominates and suppresses the instabilities that lead to slugging. This allows students to quantitatively link separator design parameters to the observed liquid breakthrough pressure threshold.
Integrating Observational and Instrumented Data
In a typical unit ops experiment, students are not just watching a flow map. They correlate the flow regime visualization (often with high-speed cameras) with real-time sensor data. A sharp rise in a downstream gas moisture analyzer or a sudden pressure spike at the gas outlet provides the instrumental signature of liquid breakthrough. By matching the visual slug transition with the sensor alarm, they learn to design control systems that can anticipate and avoid separator failure before it contaminates a process.
Understanding the Trade-offs and Limitations
No microchannel separator design can eliminate all risks. There are inherent trade-offs between throughput, operating pressure, and separation robustness.
Pressure vs. Capacity Trade-off
Operating at higher pressures to increase reactor productivity directly pushes the system toward slug flow. The trade-off is clear: you cannot simultaneously maximize system pressure and maintain a wide safety margin from liquid breakthrough unless you significantly oversize the separator or change the channel geometry. This often forces a design compromise between compactness and robustness.
Map Validity is System-Specific
The Bousman flow map is not universal. It is valid only for the exact fluid properties, channel shape, and wettability tested. If a lab uses an air-water system, the map cannot be directly applied to a high-viscosity organic liquid or a low-surface-tension refrigerant. Blindly using a published map without verifying it for the process fluid is a common pitfall that leads to unexpected separators failure.
Slugging Can Be Desirable Upstream
While slug flow is detrimental to separation, it is sometimes intentionally promoted in upstream processes like chemical reactions or heat exchange for enhanced mixing and heat transfer. This creates a system design conflict: a very effective reactor generating a slug flow at its exit will require a larger, more complex downstream separator to handle the incoming regime. Students must learn to not just optimize a single unit but to balance the requirements of an entire process train.
Making the Right Choice for Your Goal
Applying this knowledge in unit operations labs or process design requires a targeted approach based on your primary objective.
- If your primary focus is teaching multiphase flow fundamentals: Use the microchannel separator as a hands-on demonstration of the Bousman map. Have students experimentally map the transition to slug flow and definitively link the failure point to a specific set of superficial velocities, reinforcing the difference between mass flow and superficial velocity.
- If your primary focus is maximizing separator reliability in a pilot plant: Characterize your exact fluid system to generate a custom flow map. Monitor the Suratman number as a key design criterion, and always operate your system with a 20-30% margin in gas velocity above the slug-transition threshold to account for pressure fluctuations.
- If your primary focus is next-generation separator design: Focus your research on surface modifications or complex channel geometries that increase the effective Suratman number, thereby extending the stable non-slug operating region to higher system pressures without increasing the device footprint.
This same principle—linking a visible two-phase flow regime to a measurable process failure—is the foundation for troubleshooting any compact process-intensification equipment, proving that a deep understanding of slug flow is a skill that translates far beyond the microchannel itself.
Summary Table:
| Parameter / Regime | Stable Capillary Flow | Transitioned Slug Flow |
|---|---|---|
| Flow Characteristic | Liquid film along walls; gas in core | Large liquid slugs bridging the channel |
| Separation Efficiency | High (stable passive separation) | Low (liquid breakthrough at gas outlet) |
| Key Drivers | Balanced superficial velocities | Pressure-induced gas velocity decrease |
| Lab Study Method | Baseline visual/sensor monitoring | Bousman flow maps & Suratman number analysis |
Enhance Process Engineering Education and Research with LABPARK
Bring advanced multiphase flow and process intensification concepts to life. LABPARK provides state-of-the-art Educational and Vocational Unit Operations Pilot Plants in chemical engineering, bioprocess & biotech, and environmental & water treatment.
Designed specifically for universities, research institutes, and enterprises, our pilot plants enable hands-on analysis of complex phenomena like slug flow transitions, flow mapping, and liquid breakthrough.
Equip your laboratory with industry-grade training systems—contact LABPARK today to discuss your project requirements!
Related Products
- Gas-Solid Heterogeneous Separation Demonstration Educational Unit Operations Pilot Plant
- Bench Scale Dual Column Gas Separation and Capture Educational Pilot Plant
- Packed Bed Absorption Educational Unit Operations Pilot Plant
- Multi-Component Gas Pressure Swing Adsorption Pilot Plant for Unit Operations Education
- Micro-Scale Gas-Solid Catalytic Reaction Educational Pilot Plant
People Also Ask
- Why is pressure drop characterization critical in separation pilot plants? Key operational insights.
- What are the key thermodynamic considerations for gas mixture modeling? Expert Guide
- What are the primary operational objectives and physical requirements when running heterogeneous separation pilot plants?
- What are the material limitations of gas separation pilot plants? Key factors to consider.
- What are the trade-offs in olefin-paraffin separation? Optimize Pilot Plant Performance