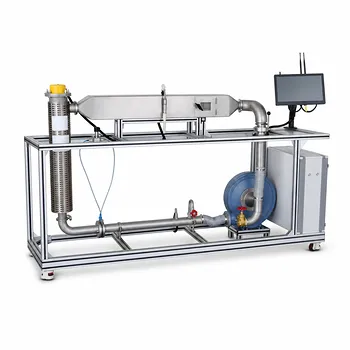
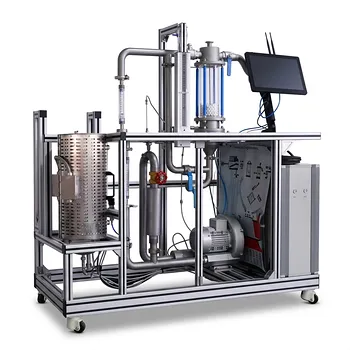
Viscosity is not just a fluid property—it’s a control variable that can completely reshape your heat exchanger’s performance.
In educational unit operations, fluid viscosity enters the convective heat transfer coefficient through two dimensionless numbers: the Reynolds number ($Re = \frac{D u \rho}{\mu}$) and the Prandtl number ($Pr = \frac{c_p \mu}{k}$). When a significant temperature gradient exists between the bulk fluid and the tube wall, a correction factor $(\frac{\mu}{\mu_w})^{0.14}$ must be applied to account for local viscosity changes—an effect that is easily isolated and demonstrated in a well‑instrumented pilot plant.
Viscosity’s role is twofold: it sets the flow regime and the thermal boundary layer character. For low‑viscosity fluids like water the correction is negligible, but for high‑viscosity oils it becomes the deciding factor for an accurate heat transfer coefficient. A pilot plant lets students move from theory to tangible, quantitative insight.
The Physics: How Viscosity Governs Heat Transfer
The Reynolds Number: Viscosity as a Flow Regime Gatekeeper
The Reynolds number directly determines whether flow is laminar, transitional, or turbulent.
Since $Re = \frac{D u \rho}{\mu}$, an increase in viscosity reduces Re for the same velocity and pipe geometry.
This can shift the flow from turbulent (where $h \propto u^{0.8}$) to laminar, causing a dramatic drop in the heat transfer coefficient.
In a pilot plant, students can run a light fluid (water) and then a viscous one (e.g., glycerol) at the same pump speed, and observe a large change in outlet temperatures—even before measuring anything else.
The Prandtl Number: Coupling Momentum and Thermal Diffusivity
$Pr = \frac{c_p \mu}{k}$ links the velocity boundary layer to the thermal boundary layer.
For many viscous fluids (high $\mu$), $Pr$ is large, meaning the momentum boundary layer is much thicker than the thermal boundary layer.
This alters the exponent on $Pr$ in Nusselt number correlations and changes the way heat is actually transferred.
Educational correlations like the Dittus‑Boelter or Sieder‑Tate equations make this explicit, and a pilot plant with multiple thermocouples helps students see the resulting temperature profiles.
The Temperature Gradient: Why Bulk Viscosity Isn’t Enough
When the fluid near the tube wall is much colder or hotter than the bulk, its local viscosity differs from the bulk value $\mu$.
The Sieder‑Tate correction factor $(\mu/\mu_w)^{0.14}$ is applied to the Nusselt number for both laminar ($Re < 2100$) and turbulent ($Re \ge 10,000$) flows of high‑viscosity fluids.
For low‑viscosity liquids like kerosene or water, the correction is close to 1 and can be safely ignored.
For heavy crude oils or polymer melts, ignoring it leads to gross errors in the calculated heat transfer coefficient and, consequently, in the required exchanger area.
In a pilot plant, the wall temperature $t_w$ is unknown a‑priori. Students must estimate it iteratively:
First calculate $h$ without the correction, then estimate $t_w$ from a heat balance, and then re‑compute $h$ with the factor—often with the help of a simple spreadsheet. This iterative loop teaches the real‑world coupling between fluid properties and heat transfer.
Demonstrating Viscosity Effects in a Pilot Plant
Direct Measurement of Individual Film Coefficients
A pilot plant equipped with variable‑speed pumps, flow meters, and precise thermocouples allows students to alter the tube‑side velocity and measure its effect on $h$.
By expanding the overall resistance equation
$$\frac{1}{U_o} = \frac{1}{h_o} + \frac{1}{h_{od}} + \frac{d_o \ln(d_o/d_i)}{2 k_w} + \frac{d_o}{d_i}\frac{1}{h_{id}} + \frac{d_o}{d_i}\frac{1}{h_i}$$
and conducting experiments at different flow rates, they can isolate the film coefficients.
Comparing results for a low‑viscosity fluid (water) and a high‑viscosity fluid (glycerol solution) makes the Re‑dependency tangible.
The convective coefficient drops exactly as predicted by the power‑law relationship $h \propto u^{0.8}$ (turbulent) or through a laminar Nusselt correlation.
Isolating the Viscosity Correction Factor
Using a viscous fluid with a large temperature difference between the bulk and the wall gives the clearest demonstration.
Students first calculate the heat transfer coefficient without the $(\mu/\mu_w)^{0.14}$ term and compare the predicted heat duty with the experimentally measured $Q$.
The discrepancy is significant. After applying the correction and the iterative wall‑temperature estimation, the predicted and measured values align within experimental error.
This directly validates the need for the correction—and shows when it can be neglected.
Handling a Varying Overall Heat Transfer Coefficient
When a viscous fluid changes temperature dramatically along the exchanger, $U$ is not constant because viscosity influences $h$ at every point.
In educational pilot plants, if $U$ varies linearly with temperature, the modified heat‑rate equation
$$Q = S_o \frac{K_{o1} \Delta t_2 - K_{o2} \Delta t_1}{\ln\left(\frac{K_{o1} \Delta t_2}{K_{o2} \Delta t_1}\right)}$$
can be employed, where $K_{o1}$ and $K_{o2}$ are the local overall coefficients at the two ends.
For highly non‑linear variations, students can divide the exchanger into segments, assume constant $U$ per segment, and use numerical integration.
This builds an appreciation for the limitations of the simple LMTD method and prepares them for industrial design.
Incorporating Fouling and Its Interplay with Viscosity
Fouling resistances $h_{od}$ and $h_{id}$ add a steady‑state penalty, but with viscous fluids the fouling layer also alters the wall temperature and thus the viscosity correction factor.
A multi‑day pilot plant run can track how the overall $U$ degrades over time, tying together two critical real‑world effects.
Understanding the Trade‑offs
Simplicity vs. Accuracy: When to Neglect the Correction
For water‑like fluids and modest temperature differences, the $(\mu/\mu_w)^{0.14}$ factor is between 0.98 and 1.02—neglecting it introduces less error than typical measurement uncertainty.
The educational value here is teaching students to do a quick sanity check before adding complexity.
For heavy oils, concentrated sugars, or any fluid with a steep viscosity‑temperature curve, the correction is mandatory.
The pilot plant experiment makes this threshold intuitive: at what $Pr$ and $\Delta T$ does the uncorrected model break down?
Educational Value vs. Industrial Realism
Running true high‑viscosity fluids (e.g., polymer melts) may require heated lines, specialized pumps, and safety protocols that go beyond a typical teaching lab.
A compromise is to use a benign viscous fluid like glycerol or a viscous sugar solution that provides the necessary Reynolds number shift without extreme handling demands.
The iterative wall‑temperature calculation adds computational load, but modern spreadsheets or simple Python scripts make it a manageable learning exercise.
The payoff is students exiting the lab with a skill directly transferable to field troubleshooting.
Making the Right Choice for Your Educational Goal
A pilot plant demonstration can be scaled to different learning levels. Choose your focus based on the core objective of the curriculum:
- If your primary focus is teaching fundamental heat transfer concepts: Run clean water experiments at multiple velocities. Have students verify the $h \propto u^{0.8}$ scaling and calculate $U$ as a function of flow rate.
- If your primary focus is linking fluid properties to heat exchanger performance: Introduce a single viscous fluid (glycerol) and compare its measured heat transfer coefficient with water. Let students compute Re and Pr for both, and identify how viscosity reduces $h$.
- If your primary focus is preparing students for industrial design challenges: Incorporate the complete Sieder‑Tate correction, iterative wall‑temperature estimation, and cases where the overall heat transfer coefficient varies along the exchanger. Use the segmented‑integration approach to demonstrate the limits of standard LMTD.
By letting viscosity become a hands‑on variable, a pilot plant transforms an abstract equation into a definitive, memorable experience that anchors theoretical knowledge in practical reality.
Summary Table:
| Key Parameter / Concept | Viscosity's Impact on Heat Transfer | Pilot Plant Demonstration Method |
|---|---|---|
| Reynolds Number ($Re$) | Higher viscosity reduces $Re$, shifting flow from turbulent to laminar and lowering $h$. | Run water vs. glycerol at identical pump speeds; observe temperature differences. |
| Prandtl Number ($Pr$) | High viscosity increases $Pr$, widening the momentum boundary layer relative to the thermal layer. | Compare temperature profiles using multi-point thermocouple readings. |
| Sieder-Tate Correction | High $\Delta T$ creates wall-to-bulk viscosity differences, requiring the $(\mu/\mu_w)^{0.14}$ factor. | Perform iterative wall-temperature calculations to align theoretical $Q$ with measured $Q$. |
| Varying Coefficient ($U$) | Viscosity changes along the exchanger length, causing $U$ to vary dynamically. | Segment the heat exchanger and apply numerical integration rather than standard LMTD. |
Bring Heat Transfer Theory to Life with LABPARK
Translating abstract transport phenomena into tangible engineering skills requires robust, real-world laboratory equipment. LABPARK provides advanced Educational and Vocational Unit Operations Pilot Plants in chemical engineering, bioprocess & biotech, and environmental & water treatment.
Designed specifically for universities, research institutes, and enterprises, our pilot plants feature high-precision instrumentation, variable-speed control, and multi-point temperature sensors. This enables students and researchers to isolate variables like viscosity, calculate Sieder-Tate corrections, and master real-world heat exchanger dynamics.
Ready to elevate your engineering lab's training capabilities? Contact LABPARK today to explore our custom pilot plant solutions!
Related Products
- Shell and Tube Heat Exchanger Heat Transfer Coefficient Determination Educational Pilot Plant
- Comprehensive Multi-Modal Heat Transfer Unit Operations Pilot Plant for Engineering Training
- Dual Mode Heat Transfer Pilot Plant for Unit Operations Training
- Three-Tube Heat Transfer Educational Pilot Plant for Unit Operations Training
- Comprehensive Heat Transfer Coefficient Determination Educational Unit Operations Pilot Plant
People Also Ask
- Why Apply LMTD Correction in Shell-and-Tube Pilot Plants & How to Determine It
- Why adjust baffle spacing in shell-and-tube heat exchanger pilot plants? Master heat transfer & pressure drop.
- How to Estimate Shell-Side Pressure Drop in a Shell-and-Tube Heat Exchanger Pilot Plant: Key Parameters Explained
- How is the fouling factor (Rd) evaluated? Key Pilot Plant Insights for Students
- How is fouling factor demonstrated using shell and tube pilot plants? Practical Lab Guide