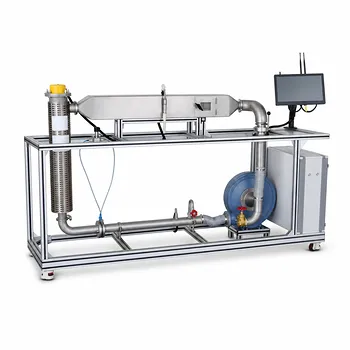
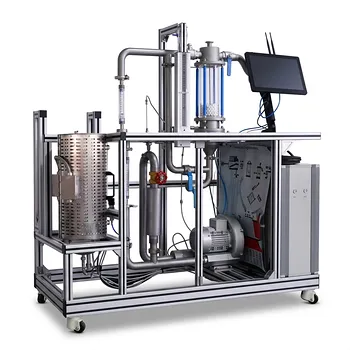
Heat exchanger heat duties are evaluated from measured flow rates and inlet/outlet temperatures, then compared with the exchanger’s thermal capacity and network-level energy balance. In an educational unit operations plant, students calculate the heat gained by a cold stream and the heat lost by a hot stream using (Q=\dot{m}C_p\Delta T), typically reporting duty in MJ/h. They then use the measured duty, exchanger area, and logarithmic mean temperature difference to estimate the overall heat transfer coefficient and assess whether preheaters, coolers, and condensers are working as intended.
The central test is consistency: the hot-side energy loss should approximately match the cold-side energy gain, while the calculated (U), temperature approaches, pressure drops, and utility consumption reveal how effectively the thermal network transfers and integrates energy.
Establishing the Operating Point
Reaching Steady State
Measurements should be taken only after flow rates and temperatures have stabilized. The essential data are the inlet and outlet temperatures of each stream, mass or volumetric flow rates, fluid properties, utility conditions, and pressure drops.
A stable operating point allows the exchanger to be treated as a control volume. In a properly insulated unit, heat exchanged with the surroundings is small compared with the process duty.
Mapping the Thermal Network
Educational pilot plants commonly connect several exchangers, including feed preheaters, product coolers, condensers, and sometimes reboilers. The network may route heat from a hot product stream into a colder feed stream rather than rejecting that energy directly to cooling water.
Typical operating demonstrations may preheat feed streams to temperatures as high as approximately 234°C or cool product streams to approximately 20°C, depending on the equipment and process conditions. These values are operating examples, not universal design limits.
Calculating Individual Heat Duties
Using the Stream Energy Balance
For a single-phase stream with approximately constant specific heat capacity, the heat duty is calculated as:
[ Q = \dot{m} C_p (T_{\text{out}}-T_{\text{in}}) ]
where:
- (Q) is the heat-transfer rate,
- (\dot{m}) is the mass flow rate,
- (C_p) is the specific heat capacity,
- (T_{\text{in}}) and (T_{\text{out}}) are the stream inlet and outlet temperatures.
The result can be converted to MJ/h for consistency with pilot-plant operating data.
For a cold stream, the temperature change is normally positive and (Q) is reported as heat gained. For a hot stream, the temperature change is negative when written in the same direction, so the hot-side heat loss is often expressed using its magnitude.
Comparing Hot-Side and Cold-Side Duties
For an insulated exchanger operating at steady state:
[ Q_{\text{cold}} \approx -Q_{\text{hot}} ]
or, using positive magnitudes:
[ \dot{m}{c} C{p,c}\Delta T_c \approx \dot{m}{h} C{p,h}\left(T_{h,\text{in}}-T_{h,\text{out}}\right) ]
The two values will rarely be identical in practice. Differences indicate heat loss, inaccurate flow or temperature measurements, changing physical properties, phase change, unsteady operation, or incorrect assumptions about the system boundary.
Accounting for Phase Change
Condensers and reboilers cannot generally be evaluated with a sensible-heat equation alone. Their duty may include latent heat:
[ Q = \dot{m} C_p \Delta T + \dot{m}\Delta H_{\text{phase}} ]
The phase-change term is included when vapor condenses or liquid boils. In a condenser, the duty may therefore consist of superheat removal, condensation, and subcooling.
Determining Thermal Performance
Calculating the Logarithmic Mean Temperature Difference
The exchanger driving force is represented by the logarithmic mean temperature difference:
[ \Delta T_{\text{lm}}
\frac{\Delta T_1-\Delta T_2} {\ln(\Delta T_1/\Delta T_2)} ]
The terminal temperature differences depend on whether the exchanger operates in countercurrent, cocurrent, or crossflow configuration. A correction factor may be required for multipass shell-and-tube arrangements.
Using the wrong flow arrangement can produce an incorrect driving force and, consequently, an incorrect heat-transfer coefficient.
Estimating the Overall Heat Transfer Coefficient
Once duty and temperature driving force are known, the experimental overall coefficient is estimated from:
[ Q = U A \Delta T_{\text{lm}} ]
Therefore:
[ U_{\text{exp}} = \frac{Q}{A\Delta T_{\text{lm}}} ]
Here, (A) is the effective heat-transfer area. The calculated (U) is a performance indicator rather than a fixed material property because it depends on flow regime, fluid properties, wall resistance, fouling, and the selected area basis.
Interpreting Thermal Resistance
For a simplified exchanger:
[ \frac{1}{U} \approx \frac{1}{h_{\text{process}}} + \frac{1}{h_{\text{utility}}} + R_{\text{wall}} + R_{\text{fouling}} ]
The film coefficient on the slower or more viscous side often contributes the largest resistance. Changing a bypass valve or flow-control setting changes velocity, which changes the convective coefficient and can substantially alter the measured duty.
For a shell-and-tube exchanger, a more detailed outside-area relationship includes shell-side and tube-side film coefficients, tube-wall conduction, and fouling resistances:
[ \frac{1}{U_o}
\frac{1}{h_o} +R_{fo} +\frac{d_o\ln(d_o/d_i)}{2k_w} +\frac{d_o}{d_i} \left(\frac{1}{h_i}+R_{fi}\right) ]
This relationship helps students connect measured performance to exchanger construction and degradation mechanisms.
Comparing Experimental and Design Values
The measured coefficient is compared with a clean or design value supplied for the exchanger. A lower experimental value may result from fouling, poor flow distribution, air entrainment, insufficient turbulence, inaccurate area assumptions, or heat loss to the surroundings.
For example, a clean design coefficient near 800 W/(m²·°C) can serve as a reference in a training exercise, but it should not be treated as a universal benchmark for every exchanger or fluid system.
Evaluating Network-Level Performance
Checking Energy Conservation Across the Network
The heat duties of connected exchangers should be reconciled across the complete flowsheet. Heat removed from one process stream may be reused by another stream, while the remaining demand is supplied by steam, hot water, refrigeration, or cooling water.
The network balance distinguishes useful heat recovery from heat that must be rejected or added by external utilities.
Measuring Heat Integration
A simple heat-recovery quantity can be estimated from the duty transferred between a hot process stream and a cold process stream:
[ Q_{\text{recovered}} \approx \min\left(Q_{\text{available, hot}}, Q_{\text{required, cold}}\right) ]
The unused portion of the hot-stream duty still requires cooling, and any unmet cold-stream demand requires an external heating utility.
This approach allows students to compare an integrated arrangement with a non-integrated arrangement in which heaters and coolers operate independently.
Assessing Temperature Approaches
The terminal temperature approach is the difference between the hot and cold stream temperatures at an exchanger end. Smaller approaches generally require more heat-transfer area and may reduce utility consumption, while larger approaches reduce area requirements but increase utility demand.
Pilot-plant exercises may use approximate baselines such as 5.6°C for ambient cooling of organics, 1.7°C for refrigeration systems, and 27.8°C for high-temperature heat recovery. These are screening guidelines, not substitutes for a detailed design or economic analysis.
Including Pressure Drop
Thermal performance must be considered alongside hydraulic performance. Educational plants may measure individual exchanger pressure drops of approximately 0.14 bar, although the actual value depends on flow rate, geometry, valve position, fluid properties, and fouling.
A higher flow rate can improve convection and increase (U), but it also increases pumping or compression requirements and may raise pressure drop beyond the intended operating range.
Understanding the Trade-offs
Higher Flow Versus Higher Utility Demand
For turbulent flow, an empirical relationship often used for instructional analysis is:
[ \frac{U_2}{U_1} \approx \left(\frac{\dot{m}_2}{\dot{m}_1}\right)^{0.8} ]
This indicates that increasing flow can increase the heat-transfer coefficient, but the improvement is not linear. The additional pressure drop and utility consumption may outweigh the thermal benefit.
Smaller Approach Versus Larger Equipment
Reducing the temperature approach increases the required exchanger area, which raises capital cost and may complicate operation. Larger approaches reduce equipment size but can increase steam, cooling-water, or refrigeration requirements.
The appropriate choice depends on the intended operating objective and can be evaluated using total annualized cost when economic data are available.
Apparent Duty Imbalance
A mismatch between hot-side and cold-side duties is not automatically evidence of exchanger failure. It may reflect heat losses, sensor bias, inaccurate flow calibration, variable heat capacity, phase change, or measurements taken before steady state.
Students should report the imbalance and investigate its likely source rather than forcing the two duties to match mathematically.
Overinterpreting a Single (U) Value
An overall coefficient calculated from one operating point does not fully characterize the exchanger. (U) changes with flow rate, temperature, viscosity, phase condition, fouling, and flow distribution.
Reliable evaluation uses several operating conditions and compares trends, not just one isolated result.
How to Apply This to Your Project
The most useful evaluation combines stream energy balances, (U A\Delta T_{\text{lm}}) analysis, hydraulic measurements, and network-level utility accounting.
- If your primary focus is heat-duty measurement: Record stable inlet and outlet temperatures and flow rates, calculate (Q) independently for both streams, and reconcile the difference as an experimental energy-balance error.
- If your primary focus is exchanger performance: Calculate (\Delta T_{\text{lm}}) and (U_{\text{exp}}), then compare the result with the clean reference while accounting for flow regime and fouling.
- If your primary focus is heat integration: Track how much hot-stream energy preheats or vaporizes another stream, then quantify the remaining heating and cooling utility requirements.
- If your primary focus is operating optimization: Examine duty, (U), temperature approach, and pressure drop together because improving one metric can worsen another.
A sound thermal-network evaluation turns routine temperature and flow measurements into evidence about energy conservation, exchanger condition, and process efficiency.
Summary Table:
| Evaluation area | Key calculation or measure | What it reveals |
|---|---|---|
| Heat duty | Q = m_dot Cp Delta T |
Heat gained or lost by each stream |
| Energy balance | Compare hot-side loss with cold-side gain | Measurement accuracy and heat loss |
| Phase change | Include latent heat in the duty | Condenser and reboiler performance |
| Thermal driving force | Logarithmic mean temperature difference (LMTD) | Exchanger temperature effectiveness |
| Overall coefficient | U = Q / (A x LMTD) |
Thermal performance, fouling, and flow effects |
| Heat integration | Compare recovered heat with utility demand | Network energy efficiency |
| Hydraulic performance | Measure pressure drop | Trade-off between flow, heat transfer, and pumping cost |
| Optimization | Review duty, U, approach temperature, and pressure drop together | Best operating balance |
Planning or upgrading a teaching, research, or industrial process facility? Contact LABPARK to discuss Educational and Vocational Unit Operations Pilot Plants tailored to your application. LABPARK supports universities, research institutes, and enterprises with integrated solutions for chemical engineering, bioprocess and biotechnology, and environmental and water treatment. Our pilot plants help teams measure heat duties, evaluate exchanger performance, study heat integration, compare operating conditions, and train students or operators using practical process data. Share your process objectives, required modules, fluid systems, and teaching or research needs with our team so we can help define a reliable, application-focused pilot-plant configuration.
Related Products
- Shell and Tube Heat Exchanger Heat Transfer Coefficient Determination Educational Pilot Plant
- Comprehensive Multi-Modal Heat Transfer Unit Operations Pilot Plant for Engineering Training
- Dual Mode Heat Transfer Pilot Plant for Unit Operations Training
- Three-Tube Heat Transfer Educational Pilot Plant for Unit Operations Training
- Comprehensive Heat Transfer Coefficient Determination Educational Unit Operations Pilot Plant
People Also Ask
- Why Apply LMTD Correction in Shell-and-Tube Pilot Plants & How to Determine It
- Why adjust baffle spacing in shell-and-tube heat exchanger pilot plants? Master heat transfer & pressure drop.
- How to Estimate Shell-Side Pressure Drop in a Shell-and-Tube Heat Exchanger Pilot Plant: Key Parameters Explained
- How is the fouling factor (Rd) evaluated? Key Pilot Plant Insights for Students
- How is fouling factor demonstrated using shell and tube pilot plants? Practical Lab Guide