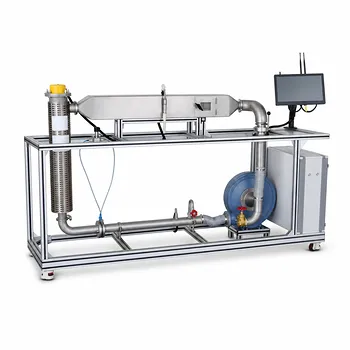
Fluid velocity isn't just a process variable—it’s the primary control knob for fouling management and operational cost in a pilot-scale shell-and-tube heat exchanger. If velocity falls too low, the reduced wall shear stress allows suspended solids or scale to settle and accumulate on tube surfaces, rapidly degrading thermal performance. If velocity rises too high, pressure drop spikes, pump energy costs inflate, and you risk flow-induced vibration or even erosion damage. In a process engineering pilot plant, careful velocity control is non-negotiable because it directly determines the balance between sustained heat transfer efficiency and practical operating limits.
The core challenge is managing a first-order trade-off: higher fluid velocity suppresses fouling by scouring tube walls and boosting the convective heat transfer coefficient, but it also amplifies pressure drop and energy demand. The goal in a pilot plant is to find the velocity window that keeps deposit formation kinetically unfavorable while not draining your utility budget or creating mechanical reliability issues.
The Dual Role of Fluid Velocity: Fouling Fighter and Cost Driver
How Velocity Suppresses Fouling at the Tube Wall
Fouling is, at its heart, a mass-transport and adhesion problem. Particles, crystallizing salts, or biological matter must first migrate from the bulk fluid to the tube surface, then attach firmly enough to form a growing deposit.
Higher velocity increases the shear stress at the wall, physically scouring the surface and preventing particles from gaining a foothold. This dramatically slows the rate of fouling-layer growth.
Simultaneously, higher velocity turbulates the flow, reducing the thickness of the stagnant thermal boundary layer. This not only increases the convective heat transfer coefficient (often significantly) but also makes it harder for foulants to diffuse to the wall.
In a pilot plant, you’ll see this first-hand. When you add more tubes to increase surface area—a common design iteration—the total flow cross-section goes up. If you don’t compensate with higher volumetric flow, the velocity in each tube drops, shear stress plummets, and fouling can accelerate unexpectedly.
Why Low Velocity Is a Fool’s Bargain
Operators sometimes dial back flow to save pump energy, assuming they have ample surface area. This is a trap.
Low velocity (< 1 m/s for many liquids on the tube side) drastically reduces the self-cleaning effect. Deposits build up exponentially faster, quickly erasing any energy savings by forcing more frequent shutdowns for cleaning. The overall dirty heat transfer coefficient (U_d) can degrade by 30–50% between scheduled cleanings if velocity is too sluggish.
Moreover, fouling resistance (R_f) is not linear with time under low shear. It often follows an asymptotic or even accelerating trend. Once a rough deposit layer forms, it becomes a nucleation site for further fouling, creating a feedback loop that velocity could have broken early on.
The Inescapable Trade-off: Pressure Drop and Energy Consumption
The Price of Shear
Pushing fluid faster doesn’t come free. Pressure drop (ΔP) increases roughly with the square of velocity for turbulent flow. A doubling of tube-side velocity can mean a quadrupling of frictional losses.
In a pilot plant, that translates directly into higher pump head requirements, increased electricity draw, and potentially larger, more expensive pump systems. If you’re simulating an industrial process, you must also consider whether your velocity target reflects realistic plant economics.
The art of pilot-plant operation is landing in the velocity sweet spot where the incremental gain in fouling suppression justifies the incremental energy cost. This is rarely the maximum safe velocity.
Where the Economic Optimum Lies
From a fouling perspective, you want the highest wall shear stress you can practically achieve. From a capital and operating cost perspective, pressure drop becomes punitive beyond a certain point.
For typical liquids on the tube side, a design velocity of 1.5–2.0 m/s provides robust anti-fouling behavior without runaway pumping costs. Water services often run between 1.5 and 2.5 m/s. On the shell side, velocities are lower (0.3–1.0 m/s for liquids) because cross-flow patterns already provide good mixing, and pressure drop rises even more sharply.
These ranges are not arbitrary—they’re the empirical result of decades of balancing fouling resistance management against ΔP in industrial and pilot-scale units.
Practical Velocity Control in a Pilot Plant Setting
Routing Fouling-Prone Streams to the Tube Side
A critical design lever you always have in a pilot plant is fluid allocation. The primary reference highlights that fouling-prone fluids belong on the tube side. Why? Because tube-side velocity is far easier to control precisely, and mechanical cleaning is straightforward.
On the shell side, flow path is tortuous and velocity distribution is less uniform; dead zones are common. That makes shell-side fouling both harder to predict and harder to remove. By placing the dirty stream on the tube side, you can design for the exact velocity window needed, and if fouling does accumulate, you can rod or hydroblast the tubes without dismantling the entire exchanger.
Avoiding Vibration and Erosion at High Flow
Chasing higher velocity to combat fouling has a hard ceiling: flow-induced vibration and erosion. On the shell side, velocities exceeding 3 m/s for liquids can trigger vortex shedding and turbulent buffeting that cause tube fretting and premature failure.
In a pilot plant, where instrumentation and observation windows are common, you can directly hear or see the early signs. Mitigation relies on limiting unsupported tube spans and using proper baffle spacing. A rule of thumb: keep unsupported spans under 1 m for 16 mm tubes, and always validate with vibration analysis if you push high-flow regimes.
Erosion is a subtler threat. Abrasive particles or corrosive fluids can scour tube inlets at elevated velocities, especially if you exceed 4 m/s for liquids. The material loss rate increases exponentially once an erosive threshold is crossed, turning a fouling prevention strategy into a maintenance nightmare.
Understanding the Trade-offs
When High Velocity Becomes the Wrong Answer
There’s a temptation, especially in a research pilot plant, to run “better than industrial” velocities to get the cleanest possible data. But that can mask real-world fouling behavior.
Excessive velocity artificially suppresses deposition that would occur at economically viable speeds, yielding overly optimistic fouling factors that won’t scale to a plant. For a pilot plant meant to generate design correlations, the velocity must be representative of the intended commercial operation. If the real plant will run at 1.5 m/s, running at 3.0 m/s in the pilot just to avoid cleaning teaches you nothing about true fouling kinetics.
Similarly, for flammable or explosive fluids, velocity must be constrained by safety, not fouling. Static charge accumulation and electrostatic discharge risks cap velocities (often < 1 m/s for low-conductivity hydrocarbons) regardless of fouling benefits.
The Hidden Cost of Too Much Cleaning
Velocity is not the only fouling management tool, and over-relying on it leads to energy-inefficient designs. A balanced approach also includes appropriate cleaning frequency and antifoulant chemicals. In a pilot plant, you can map the fouling curve against velocity and determine where a slightly lower velocity plus a scheduled chemical clean cycle yields a lower total cost of ownership than a velocity-only strategy.
The fouling factor (R_d) you calculate from the difference between clean (U_c) and dirty (U_d) overall heat transfer coefficients gives you the quantitative feedback loop. Use it to decide if your velocity setpoint is actually delivering the required cleaning interval.
Making the Right Choice for Your Pilot Plant Goal
Accurately controlling fluid velocity in a pilot-scale shell-and-tube heat exchanger is about aligning your operational parameters with your experimental or production objective. The right choice depends entirely on what you’re optimizing for.
- If your primary focus is minimizing fouling and extending run time between cleanings: Target the upper end of the recommended tube-side velocity range (1.5–2.0 m/s for liquids) while ensuring fouling-prone streams are on the tube side for precise control and easy cleaning.
- If your primary focus is optimizing energy consumption and pump operating cost: Run at the lower end of the recommended velocity band (1.0–1.5 m/s) and implement a scheduled chemical cleaning program, using periodic U_d measurements to confirm fouling remains manageable.
- If your primary focus is generating scale-up data for industrial design: Match the velocity to the intended commercial plant’s design, not to what makes pilot operations convenient—this ensures your fouling factors and pressure drop correlations translate faithfully.
- If your primary focus is safety and asset longevity (corrosive/flammable streams): Strictly observe the upper velocity limits for material compatibility and electrostatic safety, even if that means accepting a higher cleaning frequency and using fouling-resistant alloys or coatings on the tube side.
A pilot plant is a truth-teller for process design. The fluid velocity you choose for your heat exchanger doesn’t just affect a single run—it defines the credibility of your fouling predictions, the realism of your operating costs, and the reliability of your data. Treat it as the strategic control variable it is, and you’ll turn a simple flow setting into one of your most powerful levers for effective fouling management.
Summary Table:
| Velocity Regime | Typical Velocity Range | Primary Benefits | Key Risks & Drawbacks |
|---|---|---|---|
| Low Velocity | < 1.0 m/s | Low pump energy consumption | Rapid fouling accumulation, 30–50% drop in heat transfer efficiency |
| Optimal Velocity | 1.5 – 2.5 m/s (Tube side) | High wall shear stress, self-cleaning, stable heat transfer | Increased pressure drop (frictional losses increase with velocity squared) |
| Excessive Velocity | > 3.0 m/s | Maximum fouling suppression | Flow-induced vibration, tube erosion, high utility costs, unrepresentative data |
Optimize Your Process Engineering Lab with LABPARK
Are you looking to bridge the gap between academic theory and industrial reality? LABPARK provides premium Educational and Vocational Unit Operations Pilot Plants in chemical engineering, bioprocess & biotech, and environmental & water treatment. Engineered specifically for universities, research institutes, and enterprises, our systems empower students and researchers to master heat transfer efficiency, fluid velocity control, and fouling management hands-on.
Equip your laboratory with reliable, industry-grade training systems that deliver reproducible data and robust performance. Contact LABPARK today to discuss your lab requirements and request a customized quote!
Related Products
- Shell and Tube Heat Exchanger Heat Transfer Coefficient Determination Educational Pilot Plant
- Three-Tube Heat Transfer Educational Pilot Plant for Unit Operations Training
- Comprehensive Multi-Modal Heat Transfer Unit Operations Pilot Plant for Engineering Training
- Dual Mode Heat Transfer Pilot Plant for Unit Operations Training
- Circulating Wind Tunnel Drying and Convective Heat Transfer Coefficient Determination Educational Pilot Plant
People Also Ask
- Why Apply LMTD Correction in Shell-and-Tube Pilot Plants & How to Determine It
- How to Estimate Shell-Side Pressure Drop in a Shell-and-Tube Heat Exchanger Pilot Plant: Key Parameters Explained
- Why adjust baffle spacing in shell-and-tube heat exchanger pilot plants? Master heat transfer & pressure drop.
- How is the fouling factor (Rd) evaluated? Key Pilot Plant Insights for Students
- How is fouling factor demonstrated using shell and tube pilot plants? Practical Lab Guide