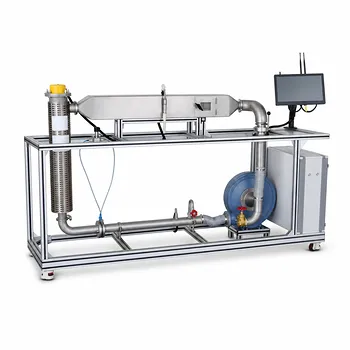
These ranges are not just numbers to memorize—they are a lens into the fundamental physics governing heat transfer. The typical overall heat transfer coefficient (U) for a shell-and-tube heat exchanger in a unit operations experiment varies drastically based on the fluids involved. For a water-to-water system, you can expect a U value in the range of 800 to 1500 W/(m²·°C). For a phase-change process like steam-to-water, the coefficient is much higher, typically 1500 to 4000 W/(m²·°C). On the other end of the spectrum, a gas-to-gas exchanger struggles to achieve more than 10 to 50 W/(m²·°C).
The standard benchmark ranges for U—from as low as 10 W/(m²·°C) for gases to over 4000 W/(m²·°C) for condensing steam—serve as a critical diagnostic tool. If your experimentally measured U falls well outside these expected values, it’s not necessarily a math error; it’s a direct signal pointing to an overlooked physical resistance, such as fouling, low fluid velocity, or an inaccurate assumption about the driving force.
Deconstructing the Thermal Resistance
The overall heat transfer coefficient is not a fundamental property of a fluid. It is a performance metric that quantifies the inverse of the total resistance to heat flow. In a unit operations lab, your goal is to identify which resistance dominates your system.
The Sum of All Barriers
The measured U value is the reciprocal of the total thermal resistance (1/U = R_total). This total resistance is a series of individual resistances stacked together.
For a standard heat exchanger tube, the overall coefficient based on the outer surface area (U_o) is built from:
- The inner convective film resistance (
1/h_i), representing fluid flow inside the tube. - The inner fouling resistance (
1/h_id), a penalty from scale or deposits. - The tube wall conduction resistance, calculated from the tube’s dimensions and metal thermal conductivity.
- The outer fouling resistance (
1/h_od). - The outer convective film resistance (
1/h_o), representing fluid flow on the shell side.
Why Fluid Type Dictates the Range
The massive gap between a gas-to-gas U value and a water-to-water U value is explained by looking at the convective heat transfer coefficients (h). Gases have inherently low thermal conductivity and density. Even at high velocities, the h value for a gas remains low, creating a dominant resistance that chokes the overall U.
Conversely, water is a relatively good conductor with high heat capacity. When steam condenses on the shell side, the condensing film coefficient is exceptionally high, effectively eliminating that resistance from the equation. The limit then becomes the water-side coefficient on the tube side, resulting in the high U values observed.
Beyond the Number: What Your Experiment is Revealing
Simply calculating U is an exercise in algebra. Understanding why it shifts during your experiment is where the real learning happens.
The Diagnostic Power of Flow Velocity
Your supplementary calculations for the shell-side coefficient reveal the direct mechanical link between flow and thermal performance. Increasing fluid velocity boosts the Reynolds number (Re). This results in a higher Nusselt number (Nu), and consequently, a higher convective film coefficient h.
If you double the flow rate on the water side and see only a marginal increase in U, it tells you that the overall process is not controlled by the water-side film. The bottleneck lies elsewhere, likely on the shell side or in the tube wall.
The Silent Efficiency Killer: Fouling
The explicit terms for h_id and h_od in the thermal resistance equation are not theoretical. These represent the fouling factors. In a pilot plant running heavy oil, the U value can drop from a clean condition of 300 W/(m²·°C) down to 50 W/(m²·°C) as a sticky film accumulates on the tube walls.
Light oils and organic solvents have inherently low thermal conductivities, making their film coefficients poor even when clean. This is why their typical U ranges are clustered between 100 and 400 W/(m²·°C). Adding even a minor fouling resistance to an already high-resistance system causes a dramatic proportional drop in performance.
Understanding the Trade-offs
The selection of a target U value for design is always an economic compromise, but in a unit operations context, it highlights a critical accuracy-versus-robustness dilemma.
Empirical Correlation vs. Experimental Reality
Empirical ranges are broad for a reason. A value of 900 W/(m²·°C) for a water-to-water system is a generic starting point, not a precise target. If you assume 900 W/(m²·°C) to calculate your required area, but your actual calculated U comes out to 786 W/(m²·°C), your exchanger is undersized by about 15%.
Your lab experiment exposes this flaw. The standard ranges (e.g., 800-1500 W/(m²·°C)) incorporate assumptions about typical fluid velocities (1-2 m/s for tube-side liquids) and baffle spacing. Operating outside these mechanical constraints—for instance, with an abnormally low shell-side velocity below 0.3 m/s—forces the real U well below the standard range.
Capital Cost and Operating Reality
Choosing a lower design U forces you to build a larger, more expensive heat exchanger to provide the necessary surface area. In a pilot plant, this might mean specifying a unit with more tubes or a longer shell.
A higher assumed U minimizes equipment size but leaves zero margin for error. If the plant tries to push a "heavy oil" design at 400 W/(m²·°C) but the oil viscosity is slightly higher than expected, the system will fail to hit the target outlet temperature immediately. The safe design trajectory, as shown in iterative selection methods, almost always trends downward toward a slightly conservative U to ensure the equipment works when reality deviates from the textbook.
Making the Right Choice for Your Analysis
Your path forward depends on whether you are validating a hypothesis or designing a new experiment.
- If your primary focus is validating your experimental data: Compare your calculated U directly against the standard ranges. If you are running a water-to-water system and getting 600 W/(m²·°C), do not adjust your math until you have physically inspected the tubes for fouling or verified your flowmeter.
- If your primary focus is understanding phase-change dynamics: Focus on the steam-to-water range. The high base value (1500-4000 W/(m²·°C)) is your proof of a successful condensation process. A sudden drop signals the presence of non-condensable gases or a flooded condensate layer, which act as insulators.
- If your primary focus is designing a new pilot-plant run: Start with the generic empirical U, but treat it as an upper bound. Deliberately calculate the pressure drop for your utility fluids—a gas velocity above 30 m/s might give you a high
hcoefficient but will likely erode your tubes and exceed your blower limits.
The ultimate goal of measuring U is not just to calculate a number, but to correlate that number with a specific, controllable physical mechanism inside your system.
Summary Table:
| Fluid Combination | Typical U Range (W/(m²·°C)) | Key Characteristics |
|---|---|---|
| Gas-to-Gas | 10 - 50 | Low thermal conductivity; dominant gas-film resistance |
| Light Oils / Organic Solvents | 100 - 400 | Moderate thermal conductivities; highly sensitive to fouling |
| Water-to-Water | 800 - 1,500 | High heat capacity; standard benchmark range |
| Steam-to-Water | 1,500 - 4,000 | Phase-change process; exceptionally high condensation coefficient |
Elevate Your Unit Operations Lab with LABPARK
Are you looking to provide students and researchers with hands-on, highly accurate heat transfer experiments? LABPARK designs and manufactures state-of-the-art Educational and Vocational Unit Operations Pilot Plants tailored for chemical engineering, bioprocess & biotech, and environmental & water treatment programs.
We help universities, research institutes, and enterprises bridge the gap between textbook theory and industrial reality with robust, transparently instrumented pilot systems.
Ready to upgrade your lab's capabilities? Contact LABPARK today to request a custom quote or discuss your laboratory requirements.
Related Products
- Shell and Tube Heat Exchanger Heat Transfer Coefficient Determination Educational Pilot Plant
- Three-Tube Heat Transfer Educational Pilot Plant for Unit Operations Training
- Comprehensive Multi-Modal Heat Transfer Unit Operations Pilot Plant for Engineering Training
- Dual Mode Heat Transfer Pilot Plant for Unit Operations Training
- Circulating Wind Tunnel Drying and Convective Heat Transfer Coefficient Determination Educational Pilot Plant
People Also Ask
- Why Apply LMTD Correction in Shell-and-Tube Pilot Plants & How to Determine It
- How to Estimate Shell-Side Pressure Drop in a Shell-and-Tube Heat Exchanger Pilot Plant: Key Parameters Explained
- Why adjust baffle spacing in shell-and-tube heat exchanger pilot plants? Master heat transfer & pressure drop.
- How is the fouling factor (Rd) evaluated? Key Pilot Plant Insights for Students
- How is fouling factor demonstrated using shell and tube pilot plants? Practical Lab Guide