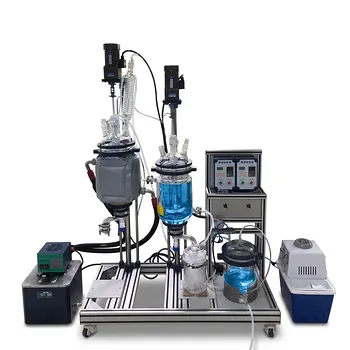
In pharmaceutical and bioprocess pilot plants, Raman spectroscopy has become a definitive tool for real-time polymorph surveillance.
By inserting an immersion probe directly into the crystallizer, the technique continuously tracks solvent-mediated and temperature-mediated polymorphic transformations. This non-destructive, in-situ monitoring reveals conversion kinetics as a function of temperature, solvent composition, stirring rate, and seed size. The data allows researchers to lock in the exact conditions that deliver the desired crystal form every time—a cornerstone of quality-by-design (QbD).
Raman transforms crystallization from a recipe‑driven step into a data‑rich process. By embedding a probe directly in the pilot‑scale vessel, teams gain continuous, contamination‑free insight into polymorph stability and phase transitions, enabling real‑time optimization that aligns perfectly with modern QbD principles.
In‑Situ Raman Monitoring of Crystallization: The Core Application
How the Immersion Probe Captures Transformation Kinetics
The Raman probe is immersed directly into the slurry.
It fires a laser through a sapphire window, collecting scattered light that carries the vibrational fingerprint of every crystal form present.
Because each polymorph has a unique Raman spectrum, the probe can distinguish stable forms, metastable forms, and transient intermediates without opening the vessel.
The Process Variables Under Real‑Time Surveillance
The primary reference frames the monitoring around temperature, solvent composition, stirring rate, and seed size.
All four variables influence which polymorph appears and how fast a transition occurs.
By systematically varying one parameter while the Raman signal streams, researchers map out the exact kinetic regime where, for example, a metastable form converts to the thermodynamically stable product.
Solvent‑Mediated vs. Temperature‑Mediated Transformations
Solvent‑mediated transitions occur when a less‑stable polymorph dissolves and the stable form nucleates from solution.
Temperature‑mediated transitions happen inside the solid state without dissolution.
Raman differentiates these pathways instantly: a sudden disappearance of a peak alongside a growing new peak indicates a solution‑mediated event, while gradual peak shifts often reflect solid‑state reorganization.
Why Raman Excels in Aqueous, Bio‑Relevant Environments
The Weak Water Signal — A Critical Advantage
In bioprocess and pharmaceutical crystallizations, water is the dominant solvent.
Mid‑Infrared and Near‑Infrared spectroscopy suffer severe interference from water’s strong absorption bands.
The Raman spectrum of water is remarkably weak, allowing direct, interference‑free measurement of solute polymorphs—even at low concentrations—without needing to dry or extract samples.
Contamination‑Free, In‑Situ Operation
Physical sampling for off‑line X‑ray diffraction risks breaching the sterile envelope of a bioprocess vessel.
A Raman probe uses either a non‑invasive viewing window or a sterilizable insert, preserving the closed‑system integrity.
This eliminates contamination risk while delivering a continuous data stream that offline methods simply cannot match.
Direct Analysis of Solute Chemistry in Polar Solvents
Many pharmaceutical crystallizations use polar solvents like alcohols or water mixtures.
Because these solvents also have weak Raman signals, the solute’s crystal‑form peaks stand out cleanly.
No sample preparation is required—just immerse the probe and begin tracking the polymorphic composition.
Unlocking Polymorph Kinetics and Stability Metrics
Simple Peak Height Quantification
Under constant experimental conditions, the number of Raman‑scattered photons is proportional to the analyte concentration.
For distinct, non‑overlapping bands, a simple peak height measurement yields a real‑time concentration trend of each polymorph.
This direct proportionality makes it easy to teach the fundamentals of kinetic modeling in a pilot‑plant setting.
Chemometrics When Spectra Overlap
Real‑world crystal mixtures often have overlapping peaks.
In those cases, multivariate tools like partial least squares (PLS) regression are employed.
These chemometric models mathematically separate the contributions of each form, giving accurate mass fractions even in complex, evolving slurries.
Tracking Both Form and Physical State
Raman spectra carry information beyond chemical identity.
Changes in crystallinity, particle size, or local molecular environment can subtly shift peak positions or widths.
Careful monitoring of these shifts provides early warning of a phase transformation before a new set of peaks fully emerges.
Enabling Quality‑by‑Design and Process Control
From Off‑Line Checks to Real‑Time Process Decisions
Traditional polymorph screening relies on end‑of‑batch X‑ray diffraction.
Raman flips the paradigm: it gives minute‑by‑minute insight into what is happening inside the vessel.
Operators can apply temperature ramps or antisolvent additions exactly when the Raman signal indicates a transition has begun.
Building a Design Space Around Polymorph Stability
With continuous Raman data, researchers can map the supersaturation vs. temperature vs. polymorph landscape.
This defines a proven acceptable range of operation where the desired form remains stable.
The resulting design space delivers robust process control and satisfies regulatory expectations for QbD.
Hands‑On Training for Modern PAT Principles
Pilot plants equipped with Raman teach operators and students how to implement Process Analytical Technology directly on the plant floor.
They learn to interpret real‑time spectra, calibrate chemometric models, and close feedback loops—skills that translate directly to full‑scale GMP manufacturing.
Navigating Limitations and Practical Challenges
Fluorescence and Matrix Interference
Some organic molecules or impurities can fluoresce under laser excitation, swamping the Raman signal.
Selecting a longer‑wavelength laser (e.g., 785 nm or 1064 nm) and optimizing probe design help mitigate this.
In some cases, fluorescence remains a hurdle that requires careful spectral pretreatment or a shift to alternative PAT tools.
Signal Intensity in Dilute or Fast‑Moving Slurries
At very low solid concentrations or high flow rates, the Raman signal may become weak.
Longer integration times or probe‑engineering enhancements (e.g., larger collection optics) can compensate.
Still, detection limits must be validated for each specific API‑solvent system.
The Need for Robust Calibration Models
Quantitative accuracy depends on the quality of the calibration.
Building a PLS model requires representative samples spanning the full range of polymorph composition, temperature, and particle size.
This upfront effort pays for itself in process understanding but should be factored into project timelines.
Probe Fouling and Maintenance
Crystal encrustation on the probe window can degrade signal quality over long runs.
Automated wash cycles or retractable probe systems are often needed to maintain data fidelity in extended campaigns.
Making Raman Work for Your Crystallization Process
The right implementation depends on your primary goal. Match your approach to the biggest risk in your crystal‑form control.
- If your primary focus is confirming polymorph stability throughout the batch: Use Raman to track the unique signature peak of the desired form, setting an alert the moment a new peak appears.
- If your primary focus is mapping phase transformation kinetics: Ramp temperature or composition stepwise while collecting continuous Raman data, then fit the peak‑area profiles to a nucleation‑and‑growth model.
- If your primary focus is teaching QbD and PAT hands‑on: Integrate the Raman probe with a data historian and let students build the chemometric model, exploring how changes in stirring or seed size shift the transition point.
- If your primary focus is maintaining sterile boundaries in a bioprocess: Rely on a non‑invasive, window‑mounted Raman probe to eliminate sampling lines entirely, preserving the closed system while still gaining real‑time polymorph insight.
When you align the Raman method directly with your risk‑based control strategy, the pilot plant becomes a true development engine—delivering not just crystals, but deep, quantitative understanding of the solid‑form landscape.
Summary Table:
| Aspect | Mechanism/Focus | Primary Benefit |
|---|---|---|
| In-Situ Monitoring | Direct laser scattering via immersion probe | Non-destructive, real-time kinetic tracking |
| Aqueous Compatibility | Weak Raman signal of water & polar solvents | Interference-free solute analysis |
| Quantification | Peak height & PLS chemometric models | Accurate polymorph mass fraction tracking |
| Process Control | Real-time phase transition feedback loops | Robust QbD design space development |
Optimize Your Pilot Plant Operations with LABPARK
Are you looking to integrate advanced PAT tools like Raman spectroscopy into your educational or research workflows? LABPARK provides state-of-the-art Educational and Vocational Unit Operations Pilot Plants in chemical engineering, bioprocess & biotech, and environmental & water treatment.
Designed specifically for universities, research institutes, and enterprises, our pilot plants deliver hands-on training and deep process insights to help you master crystallization, reaction kinetics, and process control.
Contact LABPARK today to discover how we can elevate your research and training capabilities with a tailored pilot plant solution!
Related Products
- Multi Functional Membrane Crystallization Educational Unit Operations Pilot Plant
- Potassium Salt Thermal Dissolution and Crystallization Separation Educational Unit Operations Pilot Plant
- Photocatalytic Membrane Separation and Degradation Unit Operations Pilot Plant
People Also Ask
- Control Crystallization Pilot Plant Secondary Nucleation: 4 Key Adjustments
- Why is precise temperature control critical in crystallization pilot plants? Key to Scale-Up Success
- How Crystal vs Amorphous Solids Guide Crystallization Pilot Plant Objectives
- What key factors should be considered when configuring a crystallization unit operations pilot plant?
- What are the benefits of integrating online PAT tools like ATR-FTIR into crystallization unit operations pilot plants?