The calculation of drying time in the falling-rate period hinges on numerically integrating the experimentally-determined drying-rate-versus-moisture-content curve. When the relationship between drying rate (U) and moisture content (X) becomes non-linear—the hallmark of most real-world materials—simple analytical formulas fail. Instead, you must rely on graphical integration or numerical methods like Simpson's rule applied to the differential equation (d\tau = -\frac{G'}{S} \frac{dX}{U}).
The core challenge is that internal diffusion resistance dominates the falling-rate period, producing a complex (U(X)) curve that resists closed-form integration. The solution is to collect robust experimental data from the critical moisture content (X_c) down to the final moisture (X_2), then approximate the area under the (1/U) versus (X) curve using numerical techniques.
Understanding the Drying Rate Curve and the Non-Linear Regime
The drying process is not one single event—it’s a journey through distinct physical stages. Recognizing them is the first step to calculating the falling-rate time accurately.
The Constant-Rate Period: A Simple Beginning
During the constant-rate drying period, the material surface is saturated with free moisture.
The drying rate remains steady because the surface behaves like an open water body, and mass transfer is controlled solely by external conditions (air temperature, humidity, velocity).
In this regime, the moisture content decreases linearly with time. The drying time can be computed with a simple algebraic equation—no integration headaches here.
The Falling-Rate Period: Where Complexity Emerges
Once the moisture content drops below the critical moisture content (X_c), the drying rate begins to decline.
The wet surface area shrinks, dry spots appear, and moisture must travel from the interior to the surface through increasingly tortuous paths.
This internal diffusion resistance creates a non-linear relationship between (U) and (X). The curve shape depends on material structure—porous materials (like ceramics) show different decay patterns than non-porous ones (like soaps or gels).
From Experimental Data to the Drying Rate Curve
You cannot calculate what you don’t measure. The foundation of any falling-rate calculation is a reliable, high-resolution experimental dataset.
Collecting Weight-Loss Data Under Constant Conditions
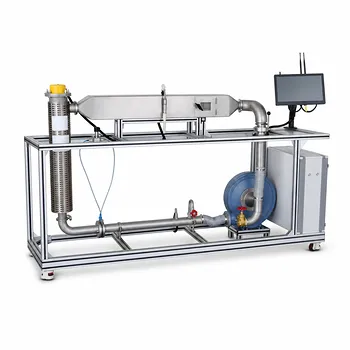
A typical unit operations experiment uses a pilot-scale tray dryer or an oven balance.
The material’s weight is recorded continuously while keeping air temperature, humidity, and velocity constant. This ensures that any change in rate is purely due to the material’s internal moisture state.
From the mass readings, you compute the bone-dry mass (G') and the instantaneout moisture content (X) (mass of moisture per mass of dry material).
Converting Data into the Drying Rate Curve
With a table of moisture content (X) versus time (\tau), apply the drying rate equation:
(U = -\frac{G'}{S} \frac{dX}{d\tau})
This conversion is typically done numerically: for each small time step, the local slope (dX/d\tau) is estimated using finite differences or by fitting a spline to the raw (X)-(\tau) data.
The result is a plot of (U) versus (X). The sharp bend where the constant-rate plateau breaks marks the critical moisture content (X_c).
Numerical Integration: Solving the Non-Linear Puzzle
With the (U(X)) curve in hand, the drying time calculation becomes a problem of finding the area under a curve.
The Governing Equation
For the falling-rate period between (X_c) and the target final moisture (X_2), the required drying time (\tau_{\text{falling}}) is given by:
(\tau_{\text{falling}} = \frac{G'}{S} \int_{X_2}^{X_c} \frac{dX}{U(X)})
When (U(X)) is non-linear, that integral has no simple antiderivative. Numerical methods become essential.
Applying Graphical Integration
The most intuitive classroom approach is graphical integration.
Plot the computed values of (1/U) on the y-axis against (X) on the x-axis between (X_2) and (X_c).
Then, measure the area under the curve—either by counting squares on graph paper or by weighing a cut-out section if your lab uses analog methods.
Multiply that area by the constant factor (G'/S) to obtain the falling-rate time.
Enhancing Precision with Numerical Rules
For higher accuracy, use systematic numerical integration algorithms.
Simpson’s Rule is a popular choice because it fits parabolic segments through consecutive triples of data points, handling curvature far better than the trapezoidal rule.
The procedure is straightforward:
- Divide the range ([X_2, X_c]) into an even number of intervals of equal width (\Delta X).
- Evaluate (1/U) at each node.
- Apply Simpson’s formula to sum the weighted areas.
Modern unit operations labs often implement this in a spreadsheet or simple script, eliminating manual arithmetic errors.
Understanding the Trade-offs and Pitfalls
Numerical integration is powerful, but it is not immune to error. A sound experimentalist knows the limitations.
Sensitivity to Data Quality and Endpoints
The integration is highly sensitive to the values of (U) near (X_2), where the rate becomes very small ((1/U) explodes).
A slight measurement noise in the slow-drying tail can disproportionately skew the calculated time. Careful data smoothing or fitting an empirical model (like a power law) to the tail region can mitigate this.
The Assumption of Constant (G'/S)
The governing equation treats (G') (bone-dry mass) and (S) (drying area) as constants.
In reality, severe shrinkage can reduce (S) during the falling-rate period, especially in colloidal or gel materials. If shrinkage is significant, the constant-area assumption introduces a systematic error that must be acknowledged or corrected via imaging techniques.
Static vs. Agitated Drying Data
Many lab curves are obtained in static tray dryers. However, industrial dryers often involve agitation (pan dryers, fluidized beds).
Agitation improves heat transfer and constantly exposes fresh wet surfaces, altering the shape of the falling-rate curve. Using a static-derived curve to design an agitated system can lead to an underestimation of the rate and an overestimation of drying time.
Making the Right Choice for Your Calculation
The best method depends on your specific goal—whether it’s deep learning, rapid estimation, or rigorous design.
- If your primary focus is mastering the physical phenomenon: Start with graphical integration. The act of plotting and measuring the area builds an intuition that no automated script can replicate.
- If your primary focus is reporting accurate lab results: Use Simpson’s rule on your collected data points. Ensure you collect denser data points near the critical moisture content and in the tail region.
- If your primary focus is scaling up to an industrial design: Always validate your laboratory-derived falling-rate curve against pilot-scale agitated equipment. Incorporate empirical correction factors to account for agitation intensity and shrinkage.
The non-linear falling-rate stage may resist a simple formula, but it surrenders its secrets to a disciplined combination of careful experimentation and robust numerical integration.
Summary Table:
| Drying Period | Rate (U) vs. Moisture (X) | Control Mechanism | Calculation Method |
|---|---|---|---|
| Constant-Rate | Constant / Linear | External conditions (temp, air velocity) | Simple algebraic formulas |
| Falling-Rate | Non-linear curve | Internal diffusion resistance | Numerical (Simpson's) or Graphical integration |
Bring Industrial-Scale Precision to Your Lab with LABPARK
Accurate analysis of drying kinetics requires robust, high-resolution experimental data. LABPARK provides premium Educational and Vocational Unit Operations Pilot Plants in chemical engineering, bioprocess & biotech, and environmental & water treatment.
Specially designed for universities, research institutes, and enterprises, our pilot plants enable students and researchers to master complex chemical engineering concepts with hands-on, reliable systems.
Ready to upgrade your laboratory setup? Contact us today to find the ideal pilot plant for your training and research needs!
Related Products
People Also Ask
- How to Determine Maximum Heat Transfer Coefficient in Reactor Pilot Plants: Wilson Plot Guide
- Why transition from laminar to turbulent flow is critical in convective heat transfer pilot plants?
- How does a unit operations pilot plant demonstrate fluid velocity vs heat transfer coefficient?
- What drives convective drying in pilot plants? Optimizing RH for efficient mass transfer.
- What are the differences between co-current and counter-current drying? Key Pilot Plant Criteria