The key difference lies in the existence of a transition temperature. In monotropic systems, one polymorph is always more stable, so a single thermodynamic equation can model solubility ratios across all relevant temperatures. For enantiotropic systems, however, the stability order flips at a specific transition temperature ((T_t)), so any model based on a fixed stability relationship is only valid below that threshold.
When modeling polymorph solubility ratios in the lab, the critical limitation is that standard thermodynamic equations like the modified Hoffman equation cannot capture the temperature-dependent stability reversal inherent to enantiotropic systems. Applying such a model above the solid-solid transition temperature will predict the wrong sign for the Gibbs free energy difference, leading to fundamentally incorrect solubility predictions.
Why the Polymorphic System Type Matters for Solubility Models
The way a pharmaceutical compound or fine chemical crystallizes determines whether a single equation can describe its solubility behavior across a processing window. Understanding the fundamental difference between monotropic and enantiotropic systems is the first step to building a reliable model.
The Defining Structural Difference
Monotropic systems have a permanent stability hierarchy. One polymorph has a lower Gibbs free energy than all others at every temperature up to the melting point. There is never a crossover.
Enantiotropic systems exhibit a reversible stability order. A critical transition temperature ((T_t)) exists below the melting points of both forms. Below (T_t), Form A is more stable; above (T_t), Form B becomes the thermodynamically favored phase.
How This Manifests in Pilot Plant Measurements
In a crystallization unit operation, this distinction is not academic. If you isolate crystals at a temperature where the desired polymorph is thermodynamically unstable, you risk a spontaneous phase transformation. The resulting shift in solubility and dissolution rate can corrupt your solubility data and make your model predictions worthless. Identifying the transition temperature experimentally is therefore a prerequisite for accurate solubility modeling.
Modeling Solubility Ratios: The Thermodynamic Foundation
Solubility ratio equations bridge the gap between solid-state properties and solution behavior. The most commonly cited framework in laboratory teaching is the modified Hoffman equation, which links the ratio of mole fractions to the Gibbs free energy difference between polymorphs.
The Core Mechanism of the Modified Hoffman Equation
The equation typically expresses the solubility ratio ((x_1/x_2)) as a function of the difference in Gibb free energy ((\Delta G_{12})) at the temperature of interest. This (\Delta G_{12}) is derived from calorimetrically measurable quantities—melting points, heats of fusion, and often an approximation for the heat capacity difference ((\Delta C_p)).
For a monotropic system, (\Delta G_{12}) maintains a consistent sign across the entire temperature range. This means a single, continuous function can describe the solubility ratio from ambient conditions up to the melting region.
The Enantiotropic Restriction: Why Temperature Boundaries Exist
For an enantiotropic system, (\Delta G_{12}) changes sign exactly at the transition temperature (T_t). Below (T_t), the stable form has a lower free energy; above (T_t), the opposite is true. Because the modified Hoffman equation relies on a fixed assignment of which polymorph is “Form 1” and which is “Form 2,” it is mathematically incapable of describing this reversal. Using the same equation above (T_t) would output a negative (\Delta G_{12}) when it should be positive, or vice versa—a thermodynamically impossible result.
Limitations That Can Undermine Your Experiment
Even within its valid temperature domain, the model carries critical weaknesses. Recognizing these limitations upfront prevents overconfidence in your numeric predictions.
The Transition Temperature Boundary
The primary reference makes it explicit: for enantiotropic systems, the solubility ratio model is strictly limited to temperatures below (T_t). Pushing the model past this boundary doesn’t just reduce accuracy—it produces a result with the wrong physical sign, making it useless for process design. In a laboratory setting, this means you must determine (T_t) experimentally before selecting the applicable temperature range for your model.
Assumptions About Solid-State Thermodynamics
Most simple models rely on the assumption that the heat capacity difference ((\Delta C_p)) between forms is constant or even zero. In reality, (\Delta C_p) can vary with temperature, and ignoring this introduces systematic error. The error is often tolerable in monotropic systems over a narrow temperature window, but near the transition temperature of an enantiotropic system, even a small misestimation can shift the predicted crossover point.
Inability to Predict Kinetics and Solvent-Mediated Transformations
Thermodynamic solubility models tell you which form is more stable at equilibrium. They cannot predict how fast a metastable form will dissolve and transform, or whether a solvent will selectively accelerate crystal growth of one polymorph. In a laboratory crystallization experiment, the measured solubility may reflect a non-equilibrium state, especially if sampling occurs shortly after apparent equilibration. Relying solely on thermodynamic equations without accounting for kinetics can lead to a false confirmation of model accuracy.
Understanding the Trade-offs
Every modeling choice involves a compromise between simplicity, practicality, and thermodynamic rigor. Acknowledging these trade-offs builds the trustworthiness of your experimental conclusions.
When you choose the modified Hoffman equation, you trade complete generality for a tractable, calorimetry-based approach. You gain the ability to run solubility ratio predictions with a handful of DSC measurements. The cost is that you must stay within the model’s valid temperature domain and accept its neglect of nuanced heat capacity variations. For rapid screening in a teaching pilot plant, this trade-off is often perfectly acceptable. For a patent filing or a scale-up decision, you may need to complement it with a more rigorous free-energy landscape calculation.
Making the Right Choice for Your Lab Experiment
The appropriate method depends on whether your polymorphic system is monotropic or enantiotropic, and what temperature range your experiment covers.
- If your primary focus is a monotropic system across a narrow processing window: A single solubility ratio model based on calorimetric data will likely suffice. Confirm that no solid-state transitions are detectable by DSC over your range.
- If your primary focus is an enantiotropic system and you must model solubility below (T_t): Use the model with the clear constraint that it is invalid above the transition temperature. Measure (T_t) experimentally first, and always report the temperature limit in your output.
- If your primary focus is an enantiotropic system and your operation spans across (T_t): Do not rely on a single fixed-stability model. Instead, split your temperature domain into two separate regions, each with the correct polymorphic stability assignment, or switch to a more sophisticated approach that directly calculates the free-energy reversal.
Grasping the distinction between monotropic and enantiotropic behavior transforms a solubility model from a mere equation into a tool you apply with informed judgment, ensuring your pilot plant predictions always align with thermodynamic reality.
Summary Table:
| Feature | Monotropic Systems | Enantiotropic Systems |
|---|---|---|
| Stability Hierarchy | Permanent (one polymorph is always stable) | Reversible (stability order flips at transition temp $T_t$) |
| Model Validity | Valid across all relevant temperatures | Strictly limited to temperatures below $T_t$ |
| Gibbs Free Energy ($\Delta G$) | Maintains a consistent sign | Changes sign at $T_t$ (causes model failure above $T_t$) |
| Key Limitations | Assumes constant heat capacity ($\Delta C_p$); ignores kinetics | Model fails above $T_t$; ignores solvent-mediated kinetics |
Optimize Your Crystallization & Thermodynamics Labs with LABPARK
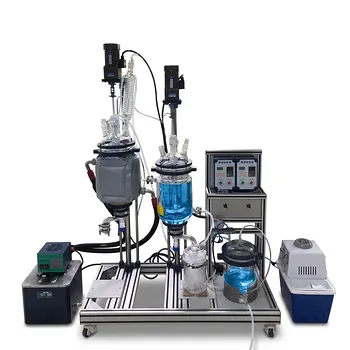
Accurate thermodynamic modeling starts with high-quality, reproducible experimental data. LABPARK provides state-of-the-art Educational and Vocational Unit Operations Pilot Plants in chemical engineering, bioprocess & biotech, and environmental & water treatment. Designed specifically for universities, research institutes, and enterprises, our pilot plants allow students and researchers to safely and accurately study crystallization, thermodynamics, and phase behavior in real-world scenarios.
Ready to upgrade your laboratory capabilities? Contact LABPARK today to find the perfect pilot plant solution for your educational or research needs!
Related Products
- Multi Functional Membrane Crystallization Educational Unit Operations Pilot Plant
- Potassium Salt Thermal Dissolution and Crystallization Separation Educational Unit Operations Pilot Plant
- Polymerization Granulation and Pellet Processing Educational Unit Operations Pilot Plant
People Also Ask
- Why is precise temperature control critical in crystallization pilot plants? Key to Scale-Up Success
- Control Crystallization Pilot Plant Secondary Nucleation: 4 Key Adjustments
- What key factors should be considered when configuring a crystallization unit operations pilot plant?
- How Crystal vs Amorphous Solids Guide Crystallization Pilot Plant Objectives
- What are the benefits of integrating online PAT tools like ATR-FTIR into crystallization unit operations pilot plants?