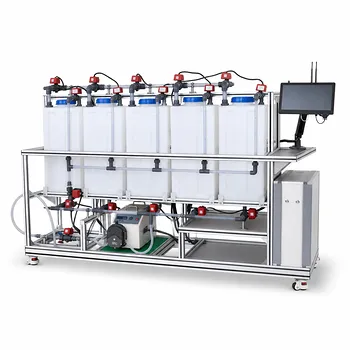
Achieving the core learning objectives—plotting U/I characteristics and calculating energy conversion efficiency—requires a pilot-scale educational setup that tightly integrates an electrolyzer, a PEM fuel cell stack, and precision instrumentation. The essential configuration connects a water electrolyzer with calibrated gas collectors to a proton exchange membrane fuel cell stack driving an adjustable electrical load. By measuring gas evolution rates at varying currents and recording stack voltage/current under different loads, students verify Faraday’s laws, construct characteristic curves, and quantify both electrolysis and fuel cell efficiency using fundamental thermodynamic references.
The heart of the lab is a closed-loop electrochemical system where students directly observe the interconversion of electrical and chemical energy. The setup must provide controlled currents, precise gas volume measurement, and automated sensor logging—turning abstract thermodynamics into a hands-on engineering investigation.
The Core Components for a Pilot-Scale Electrochemical Lab
To move from theory to measurable data, the pilot plant must be built around three tightly coupled subsystems. Each one directly influences the quality of the U/I curves and efficiency calculations.
The Electrolyzer and Gas Collection System
A PEM-based water electrolyzer is the starting point for generating hydrogen and oxygen under controlled electrical input. It must be paired with calibrated gas collectors—typically graduated cylinders or precision flow meters—to measure the volumes of H₂ and O₂ produced over time.
This arrangement allows students to vary the electrolysis current and record the corresponding gas evolution rates. Direct observation of the 2:1 hydrogen-to-oxygen volume ratio reinforces stoichiometric principles while providing the raw data needed to verify Faraday’s laws.
The PEM Fuel Cell Stack and Adjustable Load
The downstream half of the system is a modular PEM fuel cell stack. Individual cells produce only low voltage, so a stack demonstrates how series connections increase the working voltage to practical levels.
Critically, the stack must be connected to an adjustable electrical load—a variable resistor or an electronic load bank. This permits systematic variation of the discharge current. Students record the stack voltage at each load setting, generating the volt-ampere (U/I) characteristic curve that reveals activation, ohmic, and mass transport loss regimes.
Integrated Sensors and Data Acquisition
Unit operations educational equipment elevates the experiment through integrated flow, temperature, and electrical sensors. Mass flow meters on the H₂ and O₂ lines, thermocouples at the cell inlet and outlet (typically around 65 °C for PEM systems), and voltage/current probes all feed into a data acquisition system.
Automated logging eliminates manual reading errors and enables high-resolution tracking of polarization curves in real time. The sensor suite also teaches students how to identify and diagnose losses across the porous membrane and the ancillary balance-of-plant components.
Running the Experiment: From U/I Curves to Faraday’s Law
With the hardware in place, the experimental protocol directly targets the two pillars of the learning outcome.
Measuring Volt-Ampere (U/I) Characteristics
Starting at zero load (open circuit), students incrementally increase the discharge current on the fuel cell stack. At each step they log the steady-state voltage. The resulting U/I curve is immediately diagnostic:
- A steep drop at very low currents indicates activation overpotential.
- A linear slope at mid-currents reflects ohmic resistance in the membrane and contacts.
- A sharp voltage fall at high currents signals mass transport limitations as reactant gases fail to reach the catalyst sites fast enough.
Plotting this curve with clear labels turns electrochemical theory into a tangible engineering map of performance bottlenecks.
Verifying Faraday’s Laws with Gas Volume Measurements
Simultaneously, students operate the electrolyzer at a range of fixed currents and record the volume of hydrogen and oxygen generated over a measured time. According to Faraday’s laws, the amount of substance produced is directly proportional to the total electric charge passed.
Comparing the actual gas volumes to the theoretical values (calculated from current, time, and the standard molar volume of 22.4 L/mol) gives the faradaic efficiency of the electrolyzer. This experiment proves the conservation of charge in electrochemical reactions and introduces the concept of parasitic losses—such as crossover gas leakage—in practical cells.
Calculating Efficiency: Bridging Theory and Practice
Efficiency calculations are the bridge that connects fundamental thermodynamics with real-world engineering. The pilot plant makes it straightforward to collect all necessary parameters.
Electrolysis Efficiency: Electrical Input vs. Hydrogen Energy Content
For the electrolyzer, the theoretical energy requirement is given by the standard molar enthalpy of water formation (approx. 285.86 kJ/mol). The actual electrical energy input is simply voltage × current × time. Efficiency is then:
η_electrolysis = (ΔH × n) / (U × I × t)
Where n is the moles of hydrogen produced, derived from the measured volume at standard conditions. Because real cells operate above the thermoneutral voltage due to overpotentials, this efficiency is always less than 100%—often in the range of 60–80% for well-designed educational PEM electrolyzers.
Fuel Cell Efficiency: Electricity Output vs. Chemical Energy Consumed
The fuel cell efficiency is the inverse process. The output electrical energy is U × I × t, and the input chemical energy is ΔH × n where n is the moles of hydrogen consumed. The formula for fuel cell efficiency is:
η_fuel_cell = (U × I × t) / (ΔH × n)
By using the same thermodynamic baseline (the higher heating value, ΔH, for liquid water), students can calculate efficiency and immediately observe that a single PEM cell’s voltage of around 0.7 V under load corresponds to an efficiency near 50%, while lower voltages due to losses reduce it further. This computation starkly contrasts with the theoretical maximum of over 80% and benchmarks it against the ~30% efficiency of typical combustion engines.
Understanding the Trade-offs and Real-World Limitations
A well-designed educational setup doesn’t hide the complexities—it exposes them. This section is where students learn the engineering judgment that separates idealized models from operational plants.
Voltage Losses and Polarization Curves
Real fuel cells never achieve the 1.23 V theoretical open-circuit voltage consistently under load. The U/I curve directly visualizes the three major losses: activation polarization, ohmic losses, and concentration polarization. These stem from sluggish kinetics at the electrodes, ion transport resistance in the membrane, and limited mass transport of reactants.
A pilot plant that explicitly measures these effects—perhaps by varying temperature or reactant flow rates—teaches students to diagnose and mitigate losses through catalyst loading, membrane thickness, and flow field design—all core topics in electrochemical engineering.
Balance-of-Plant and System Integration Challenges
A fuel cell stack is not a stand-alone power source. The pilot plant must include flow controllers, water management subsystems, and thermal regulation, which collectively consume auxiliary power.
When students include the energy consumption of pumps, compressors, and heaters in the system-level efficiency calculation, they see the gap between cell efficiency and system efficiency. This insight is critical for understanding why commercial fuel cell systems require sophisticated engineering to approach high net efficiencies.
Making the Right Choice for Your Educational Goal
The exact configuration of your lab depends on the depth of analysis you want to enable. Prioritize the sensors and components that align with your primary learning outcomes.
- If your primary focus is demonstrating electrochemical fundamentals: Start with a simple electrolyzer, gas collectors, and a single-cell fuel cell. The focus should be on verifying Faraday’s laws and plotting basic U/I curves without complex automation.
- If your primary focus is process engineering and system analysis: Invest in a modular stack, comprehensive mass flow meters, temperature controllers, and a data acquisition system. This configuration reveals the balance-of-plant impact on net efficiency and polarization behavior.
- If your primary focus is renewable energy systems integration: Couple the electrochemical rig with a solar panel or wind turbine simulator to power the electrolyzer. Students then analyze full energy conversion chains from intermittent sources to stored hydrogen and back to electricity.
A well-configured pilot plant turns the laboratory into a powerful bridge—connecting the equations of thermodynamics to the tangible reality of a hydrogen-powered future.
Summary Table:
| Subsystem | Key Components | Main Educational Purpose |
|---|---|---|
| Electrolyzer System | PEM Electrolyzer, Gas Collectors | Verify Faraday's laws, measure H₂/O₂ rates, and calculate faradaic efficiency. |
| Fuel Cell Stack | PEM Fuel Cell, Adjustable Load | Plot U/I polarization curves, analyze activation, ohmic, and mass transport losses. |
| Instrumentation & DAQ | Flow/Temp Sensors, Voltage/Current Probes | High-resolution real-time data logging, system-level energy balance calculation. |
Elevate Your Engineering Lab with LABPARK
Ready to equip your students and researchers with hands-on, high-performance training systems? LABPARK designs and manufactures state-of-the-art Educational and Vocational Unit Operations Pilot Plants tailored for universities, research institutes, and enterprises.
Whether your program focuses on chemical engineering, bioprocess & biotech, or environmental & water treatment, our systems provide the precise control, automated data acquisition, and reliability you need to bridge thermodynamic theory and practical engineering.
Contact LABPARK today to discuss your laboratory configuration requirements and request a customized quote!
Related Products
- Water Electrolysis Hydrogen Production and Storage Educational Pilot Plant
- Alkaline Membrane Water Electrolysis Educational Pilot Plant Unit Operations Training System
- Electrolytic Hydrogen Production Educational Unit Operations Pilot Plant
- Electrochemical Water Treatment Educational Unit Operations Pilot Plant
- Electrolyte Distillation Purification and Formulation Educational Pilot Plant
People Also Ask
- How do chemical engineering pilot plants demonstrate electrolysis? Bridge Theory & Industrial Scale
- In educational chemical engineering pilot plants, why use absorption and adsorption before reforming?
- How do chemical engineering unit operations pilot plants demonstrate catalytic high-purity hydrogen production from methane?
- SMR, POX, or ATR? Trade-offs in Hydrogen Production Educational Pilot Plants
- What are the core parameters of water electrolysis efficiency? Master them with pilot plants.